Figures & data
Table 1 Primer Sequences for qPCR
Figure 1 PFN1 expression in kidney tissue from DN patients and genome-wide gene expression profiles. (A) The expression levels of PFN1 in DN kidney tissues compared to normal tissues. (B) ROC curve and AUC value of PFN1. (C) Principal component analysis of the top 10 differentially expressed genes between low-expression and high-expression PFN1 groups. (D) Volcano plot of the 186 differentially expressed genes between the low-expression and high-expression PFN1 groups. (E) Heat map of the 186 differentially expressed genes with hierarchical clustering.
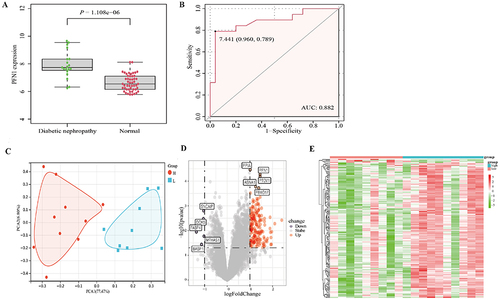
Figure 2 Functional enrichment analysis of the 186 differentially expressed genes and KEGG pathway analysis between low expression and high expression PFN1 groups. (A and B) The results of Go function analysis. (C and D) The results of KEGG enrichment analysis. (E) Patients with high PFN1 expression exhibited significant enrichments of nicotinate and nicotinamide metabolism, the pentose phosphate pathway, proteasome, aminoacyl tRNA biosynthesis in GSEA enrichment analyses. Furthermore, high PFN1 expression was negatively associated with glycosaminoglycan biosynthesis, heparin sulfate, neuroactive ligand receptor interactions, Hedgehog signaling pathway, and dilated cardiomyopathy. (F) Based on KEGG analyses, patients with high PFN1 expression exhibited significant enrichments of the citrate cycle (TCA cycle), valine, leucine, and isoleucine biosynthesis, and valine, leucine, and isoleucine degradation in GSVA enrichment analysis.
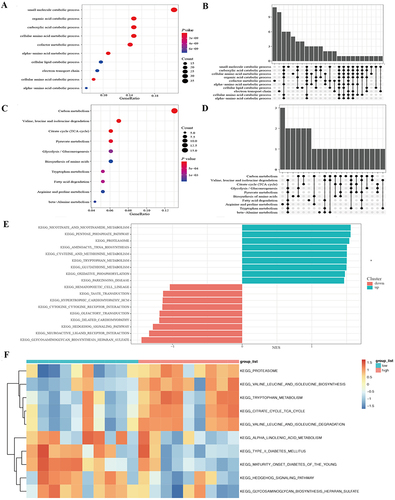
Figure 3 Correlations between PFN1 expression and PPI network analyses of the 186 differentially expressed genes. (A) The apoptosis-associated scores of PFN1 in DN kidney tissues. (B) The autophagy-associated scores of PFN1 in DN kidney tissues. (C) The senescence-associated scores of PFN1 in DN kidney tissues. (D) The PPI network constructed by the STRING online database. (E) The PPI network was presented using Cytoscape software. Red indicates upregulated genes and blue indicates downregulated genes. (F) Eight hub genes were identified from the PPI network by the MCODE plugin. (G) The correlation analysis among the hub genes. X means P>0.05, no significant difference.
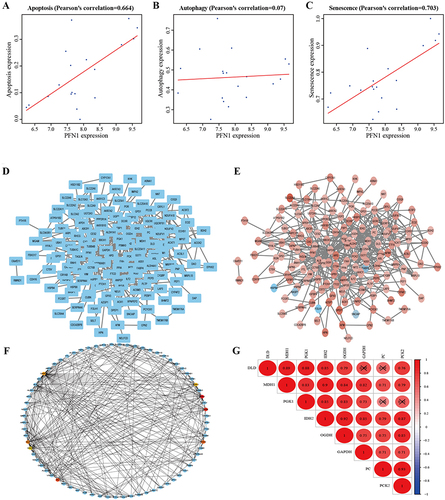
Figure 4 PFN1 was related to the inactivation of the Hedgehog signaling pathway in HK-2 cells induced with high levels of glucose for 72 h. (A) The shRNA and expression plasmid were successfully transfected in HK-2 cells. Q-PCR analysis indicating that the expression of PFN1 was significantly increased in the PFN1 overexpression group, while it was decreased in the PFN1 shRNA knockdown group. (B) Over-expression of PFN1 decreased the expression of Gli1, SHH, and MDH1, whereas PFN1 knockdown up-regulate those genes. (C) Protein expression was quantified by densitometry. Mean ± SD; n = 3; **P < 0.01 vs the control group; ##P < 0.01 vs the group treated with high levels of glucose for 72 h. Western blot of PFN1 (15 kDa), MDH1 (36 kDa), Gli1 (150 kDa), SHH (50 kDa), and β-actin (42 kDa).
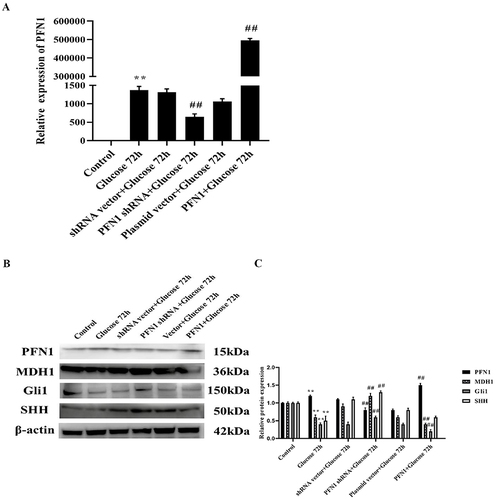
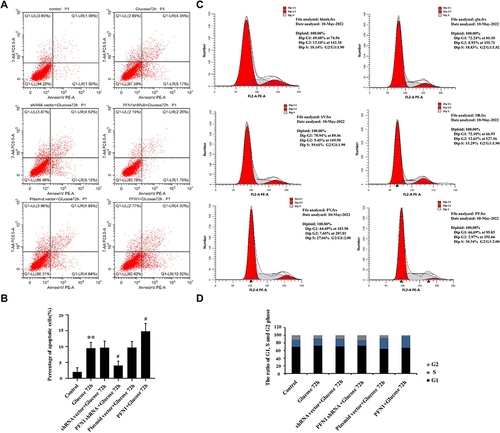
Figure 5 Cell cycle and cell apoptosis were measured by flow cytometry in HK-2 cells treated with high levels of glucose for 72 h. (A) The percentage of apoptotic cells was measured by AnnexinV/7-AAD staining. (B) Statistical analysis of the percentage of apoptotic cells. PFN1 over-expression increased apoptosis, while PFN1 knockdown decreased apoptosis. (C) The percentage of the cell cycle was measured using flow cytometry with PI staining. (D) The ratio of G1, S and G2 phase in cell cycle. Compared to the group treated with glucose for 72 h, the ratio of cells in the G0/G1 and S phase remained unchanged, while the proportion of cells in the G2/M phase decreased, inhibited proliferation in the PFN1 over-expression group. Mean ± SD; n = 3; **P < 0.01 vs the control group; #P< 0.05 vs the group treated with glucose for 72 h.