Figures & data
Figure 1 Cx43 AS downregulated Cx43 expression of glomeruli in control and ORI mice respectively. (A–D) Representative image of kidney stained with IHC for Cx43. Standard bar = 50µm. (E) The expression level of Cx43 mRNA in glomeruli at the 4th week after osmotic pump implantation of Cx43 antisense oligodeoxynucleotide (AS) or scrambled oligodeoxynucleotide (SCR). Data represent mean ± SEM (n=12 per group), and one-way ANOVA with LSD-t multiple comparison test was performed; ##P < 0.01, Con-SCR vs ORI-SCR. *P < 0.05, **P< 0.01, ORI-SCR vs ORI-AS or Con-SCR vs Con-AS.
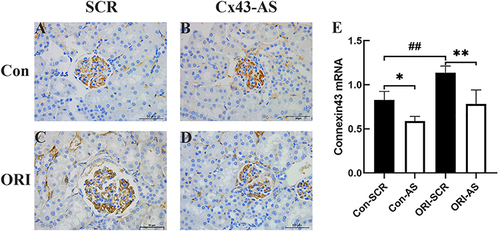
Figure 2 The effect of High-fat diet on the body weight of ORI mice. (A) Representative mouse image, (B) Body weight of mice were recorded following 12 weeks on normal diet or high-fat diet. Data represent mean ± SEM (n=24 per group). Independent samples t-test was performed. ###P < 0.001 vs control group.
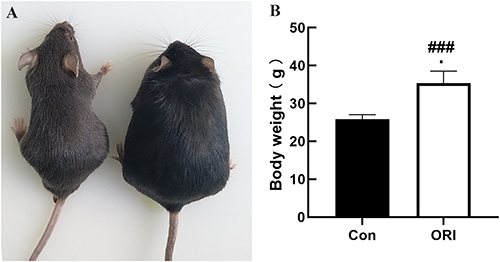
Figure 3 Biochemical parameters of mice in the groups at the 4th week after osmotic pump implantation of Cx43 AS or SCR. (A) Body weight, (B) Live weight, (C) Triglyceride, (D) Cholesterol, (E) ACR (urinary microalbumin to creatinine ratio), (F) Blood urea nitrogen, (G) Serum creatinine. All data represent mean ± SEM (n=12 per group), and one-way ANOVA with LSD-t multiple comparison test was performed; n.s. not significant, ###P < 0.001, ##P < 0.01, Con-SCR vs ORI-SCR. ***P < 0.001, *P < 0.05, ORI-SCR vs ORI-AS or Con-SCR vs Con-AS.
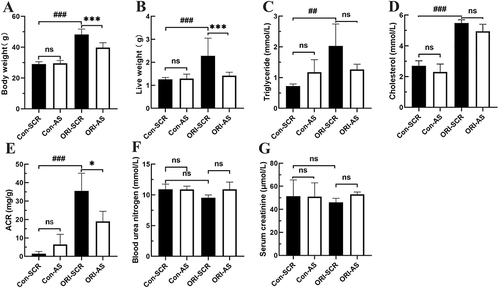
Figure 4 The effect of Cx43 AS on the cross-section area of glomerulus of ORI mice. (A–D) Representative image of kidney section stained with Periodic Acid Schiff (PAS). Standard bar = 50µm. (E) the effect of Cx43-AS on the cross-section area of glomerulus of ORI mice. All data represent mean ± SEM (n=12 per group), and one-way ANOVA with LSD-t multiple comparison test was performed, #P < 0.05, Con-SCR vs ORG-SCR. *P < 0.05, ORG-SCR vs ORG-AS or Con-SCR vs Con-AS.
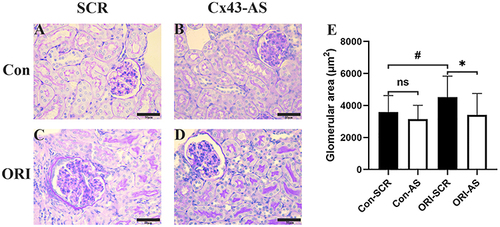
Figure 5 The effect of Cx43 AS on the podocyte injury of ORI mice. (A–D) Representative image of kidney section stained with IHC for WT-1. Standard bar = 50µm. (I) The effect of Cx43 AS on the WT-1 positive cells in glomeruli. (E–H) Representative image of kidney section stained with IHC for Nephrin. Standard bar = 50µm. (J) The percentage of Nephrin positive area stained with IHC. All data represent mean ± SEM (n=12 per group), and one-way ANOVA with LSD-t multiple comparison test was performed; n.s. not significant, #P< 0.05, ##P< 0.01, Con-SCR vs ORG- SCR., *P < 0.05, **P < 0.01, ORI-SCR vs ORI-AS or Con-SCR vs Con-AS.
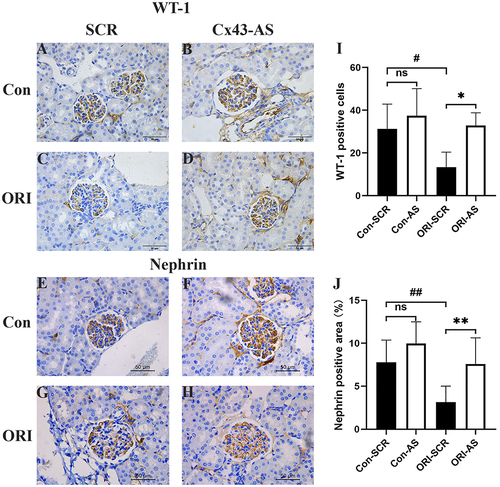
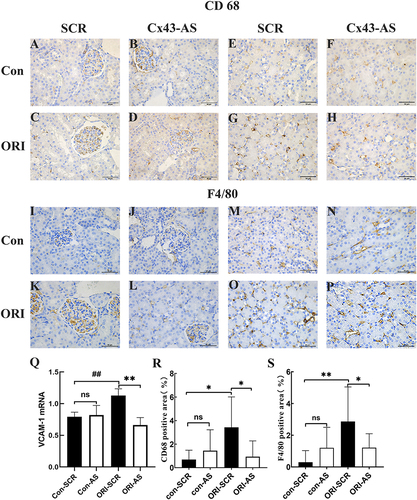
Figure 6 The effect of Cx43 AS on inflammatory infiltration of ORI mice. (A–H) Representative image of kidney section stained with IHC for CD68. Standard bar = 50µm. (I–P) Representative image of kidney section stained with IHC for F4/80. Standard bar = 50µm. (Q) The expression of VCAM-1 mRNA in renal tissue of mice. (R and S) The results of the imaging quantitative analysis of the expression of CD68 and F4/80. All data represent mean ± SEM (n=12 per group), and one-way ANOVA with LSD-t multiple comparison test was performed; n.s. not significant, ##P < 0.01, Con- SCR vs ORI-SCR. **P < 0.01, *P < 0.05, ORI-SCR vs ORI-AS or Con-SCR vs Con-AS.