Figures & data
Table 1 The Primers Used for qPCR Analysis of 16S rDNA
Table 2 Demographic Characteristics
Figure 1 Gut microbiota analysis. (A) Principal coordinates analysis (PCoA) of the BDM group (n = 10) and NBT2DM group (n = 10) subjects based on unweighted UniFrac distance measures (Yellow triangles: BDM group; blue circles: NBT2DM group); (B) Shannon index of alpha diversity in the BDM group and NBT2DM group; (C) Taxonomic summary of the fecal microbiota at the phylum level and (D) at the genus level; (E) Discriminative taxa at the species level as determined by linear discriminant analysis (LDA) effect size.
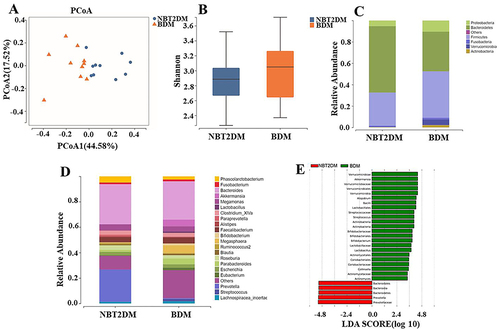
Figure 2 Correlation between glycemic fluctuation and bacterial relative abundance. (A) Prevotella copri, r = −0.477, P = 0.034; (B) Bifidobacterium, r = −0.389, P = 0.090; (C) AKKermansia, r = 0.176, P = 0.458; (D) Collinsella, r = 0.360, P = 0.119; (E) Streptococcus, r = 0.411, P = 0.072; (F) Lactobacillus, r = 0.067, P = 0.780.
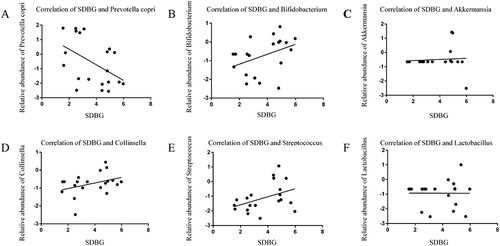
Table 3 Clinicopathological Parameters of the Subjects in the Validation Cohort
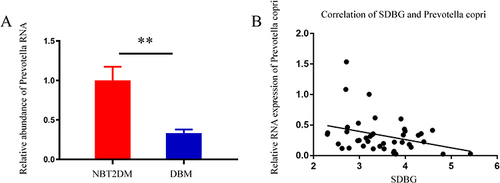
Figure 3 (A) Comparison of the content of Prevotella copri in the intestinal flora of the validation cohort. The abundance of Prevotella copri in the intestinal flora of patients with BDM was significantly lower than that of patients with NBT2DM, P = 0.002 (**P≤0.01); (B) Validation cohort analysis of the correlation between the intestinal Prevotella copri abundance and glycemic fluctuation in patients with BDM, r = −0.318, P = 0.043.