
Figures & data
Table 1 Baseline Characteristics of the T2DM Patients in the Study (n=431)
Figure 1 Comparation of HbA1c (A), FPG (B), weight (C), insulin dose (D) levels at different visit point during the study (n=431 except insulin dose n=280). Data are shown as mean ± sd. &p<0.05 represents V1 vs V0; *p < 0.05 vs V1; #p < 0.05 vs V2.
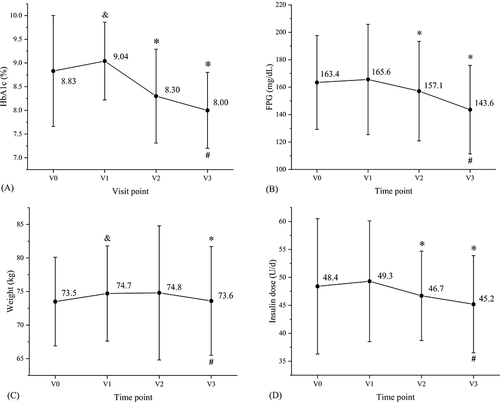
Figure 2 Change of daily glycemic profile at 4 time points from baseline to the study end (n=431). Data are shown as mean. *p < 0.05 vs baseline; #p < 0.05 vs 3 month.
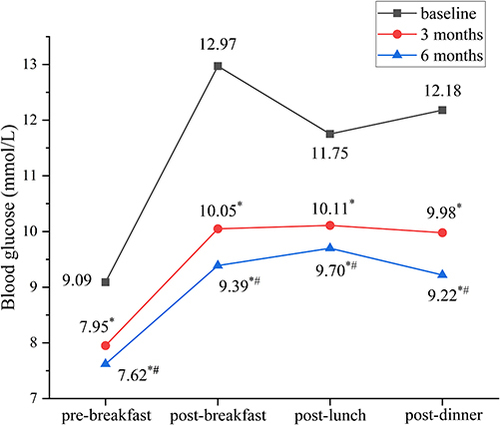
Figure 3 The difference of Lipid profile (A), islet function index (B) at 4 visit points during treatment (n=431 except islet function index n=151). Data are shown as mean ± sd. &p<0.05 represents V1 vs V0; *p < 0.05 vs V1; #p < 0.05 vs V2.
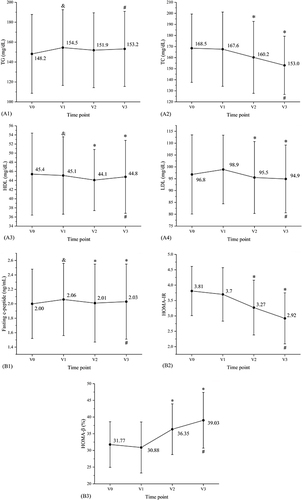
Table 2 Change in Anti-Diabetic Medication During the Study (n=431)
Figure 4 The proportion of participants maintaining different HbA1c levels at baseline and follow-up (n=431).
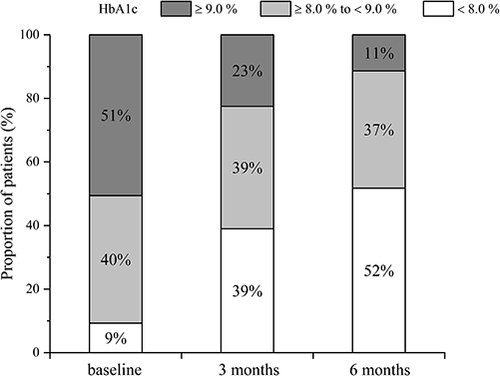
Figure 5 Change in HbA1c after the treatment stratified by glycemic control at baseline (A) and average duration of HI per day (B) (n=431). *p < 0.001.
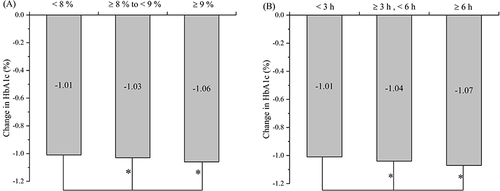
Table 3 Linear Regression Analysis of Baseline Parameters in Relation to HbA1c Change at the End of Study (n=431)
Table 4 Adverse Event Recorded Throughout the Study (n=431)