
Figures & data
Table 1 Primer Sequences for RT-PCR in Human
Table 2 Baseline Patient Characteristics
Figure 1 Representative FACS dot-plots used for the quantification of Tregs, FACS for the quantification of the suppressive function of Tregs, and qPCR for the quantification of FOXP3, IL-10, and TGF-β mRNA expressions. PBMCs were stained with anti-CD4-FITC, anti-CD25-PE, and anti-FOXP3-APC antibodies. (A) Tregs were defined as CD4+CD25+ FOXP3+ cells in the three groups; the average fractions of Tregs are shown in the right panels (n = 15 in each group). FOXP3 (B), TGF-β (C), and IL-10 (D) mRNA expressions in Tregs of the three groups (n = 8 in each group). (E) Representative suppressive functions of Tregs in the three groups are presented (n = 6 in each group). The CD4+CD25+ cells (Tregs) and CD4+CD25- cells were isolated and cocultured at a ratio of 8:1 for 72h. The proliferation of Teff was detected by FACS. *p< 0.05; **p < 0.01.
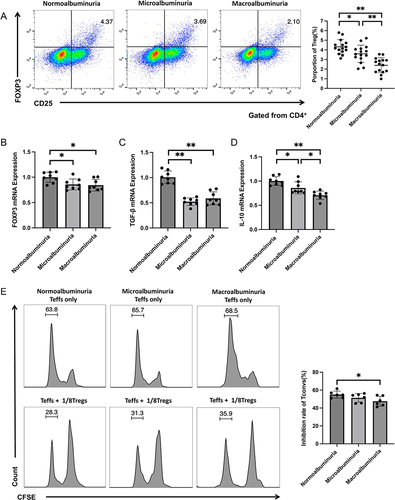
Figure 2 Representative FACS dot-plots were used for the quantification of T cell subpopulations and qPCR for the quantification of inflammatory factor mRNA expressions. PBMCs were stained with anti-CD4-PerCP-Cy5-5, anti-IFN-γ-FITC, IL-17A-PE, and anti-IL-4-PE antibodies (n = 15 in each group). (A) Th17 cells were defined as CD4+IL-17A+ cells in the three groups; the average fractions of Th17 cells are shown in the right panels. (B) Th1 cells were defined as CD4+IFN-γ+ cells in the three groups, the average fractions of Th1 cells are shown in the right panels. (C) Th2 cells were defined as CD4+IL4+ cells in the three groups, the average fractions of Th2 cells are shown in the right panels. The IL-6 (D), IL-17 (E), and IFN-γ (F) mRNA expressions in PBMCs of the three groups are shown (n = 8 in each group). *p< 0.05; **p < 0.01.
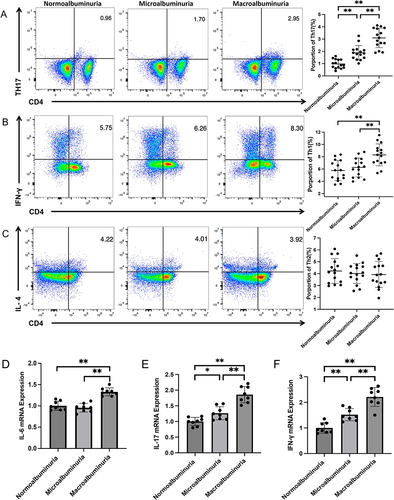
Table 3 Glycemic Parameters Obtained from CGM
Figure 3 Linear correlation between the frequency of T cell subpopulations and some indexes of short-term GV. The relationships between the MAGE and frequency of Tregs (A), Th17 (B), Th1 (C), and Th2 (D) are shown. The relationships between the TIR and frequency of Tregs (E), Th17 (F), Th1 (G), and Th2 (H) are presented.
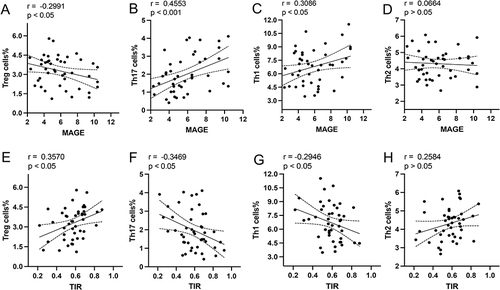
Table 4 Multivariate Linear Regression Model of GV Parameters Related to the Proportion of T Cell Subpopulations