Figures & data
Figure 1 Flow chart of the entire study.
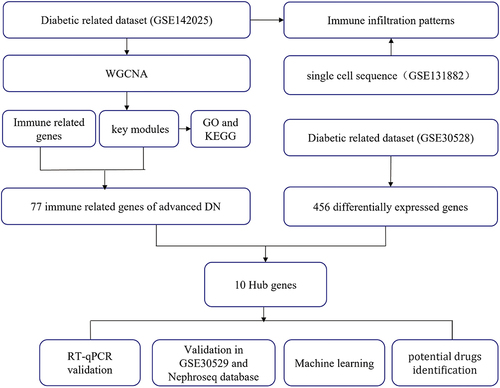
Figure 2 Construction of a weighted co-expression network and identification of key modules. (A) Analysis of the scale-free network for soft threshold powers and the mean connectivity for soft threshold powers. The soft-thresholding power was set as 11. (B) Heatmap of module-trait relationships containing correlation coefficients and p values.
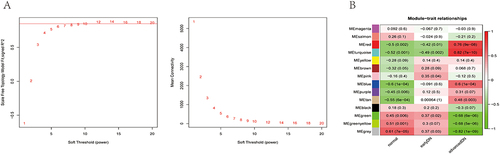
Figure 3 GO enrichment analysis of the genes in the turquoise and red modules. (A) BP, biological process; (B) CC, cellular component; (C) MF, molecular function. (D) KEGG pathway enrichment analysis of the genes in the turquoise and red modules.
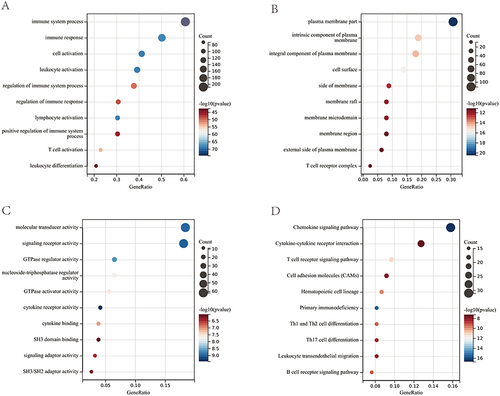
Figure 4 Identification and validation of 10 hub genes. (A) Venn diagram showing the overlap of genes between immune-related genes in the turquoise and red modules and the DEGs in GSE30528. (B) Validation of 10 hub genes in GSE30529. (C) Validation of 10 hub genes in Nephroseq. (D) RT‒qPCR showed the mRNA expression level of hub genes in kidney tissues of rats in each group. DN, diabetic nephropathy; Chaga, treatment with 100 mg/kg chaga. *P < 0.05, **P < 0.01, ***P < 0.001, ****P < 0.0001.
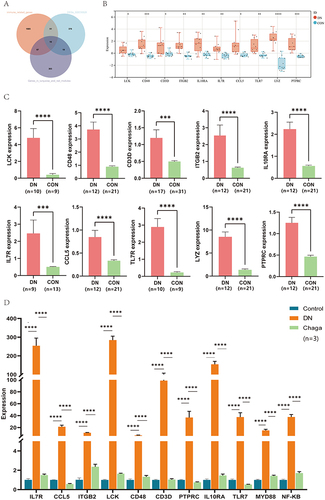
Figure 5 Developing the diagnostic model based on machine learning. (A) The tree model indicated that the error had stabilized. (B) The relative relevance of 10 hub genes. (C and D) The receiver operating characteristic curves with 5-fold cross-validation of RF, SVM, AdaBoost and KNN.
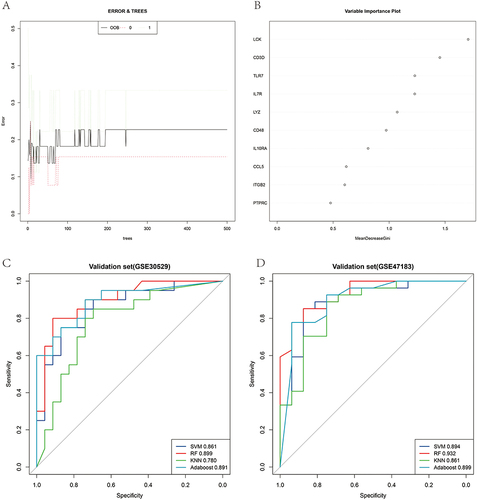
Figure 6 Immune infiltration patterns based on bulk sequence analysis. (A) Abundance of immune cell types in GSE142025. (B) Abundance of immune cell types in GSE30529. (C) Comparisons between immune cells in advanced DN, early-stage DN and normal control samples in GSE142025. (D) Comparisons between immune cells in DN and normal control samples in GSE30529. *P < 0.05, **P < 0.01, ***P < 0.001, ****P < 0.0001, -P > 0.05.
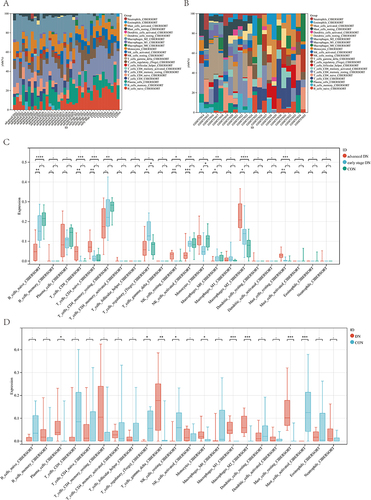
Figure 7 Immune infiltration patterns based on single-cell sequencing analysis. (A and B) Cell clusters for GSE131882 of 3 healthy controls and 3 patients with diabetic nephropathy. (C) Proportions of different cell clusters in normal and diabetic nephropathy kidney tissues. (D) Differential number of interactions and interaction between diabetic nephropathy and normal samples. (E) Differential number of interactions and interaction strength for the comparison of diabetic nephropathy and normal samples between podocytes and immune cells. The red line represents enhancement, and the blue line represents reduction. (F) All the signaling pathways between diabetic nephropathy and normal samples ranked based on their differences in overall information flow within the inferred networks. Signaling pathways indicated in red are more enriched in normal group, signaling pathways indicated in blue are more enriched in diabetic nephropathy group, signaling pathways indicated in black were not significantly different between the normal and diabetic nephropathy groups. (G) Comparison of important ligand‒receptor pairs for all signaling pathways between DM and control samples of podocytes and immune cells.
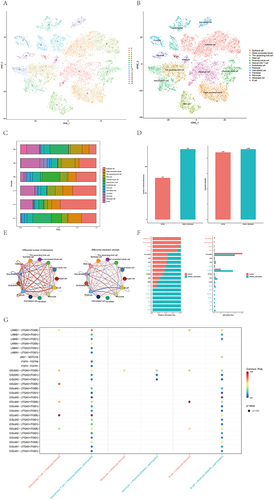
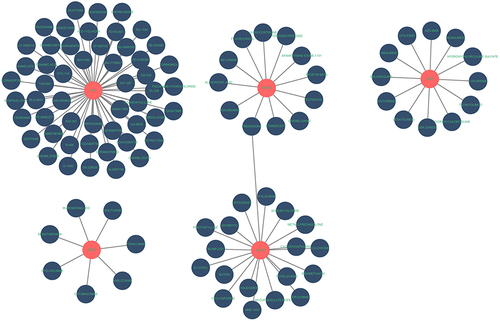
Figure 8 Prediction of hub gene-targeted drugs. The drugs may target the hub genes identified by the DGIdb.