Figures & data
Figure 1 Basic flow chart of the experiment.
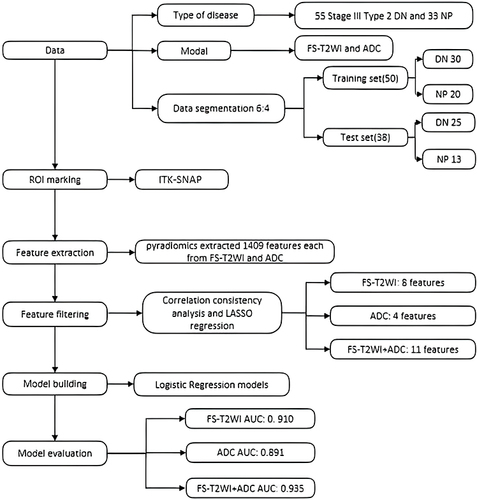
Figure 2 Respective MR images of the right kidney with stage III type 2 DKD and normal persons (NP). The ROI were curved over the renal parenchyma of the right kidney (red curve). In this study, the images analyzed were the FS-T2WI and ADC maps. (Female patient with DKD, 54 years old, stage III diabetes nephropathy, creatinine value was about 135.7, BMI index was 28.41).
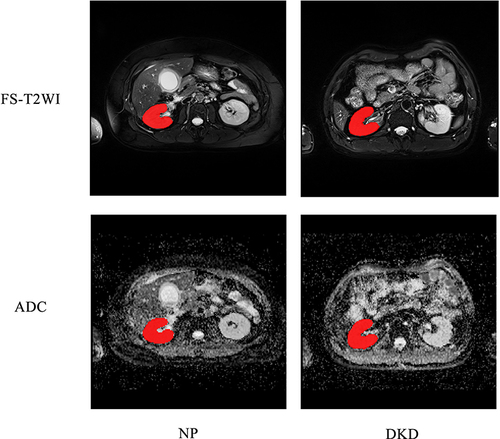
Table 1 Patient Characteristics in the Training and Test Set
Table 2 The Imaging Features Based on FS-T2WI, ADC and United Model
Figure 3 The ICC of ADC.
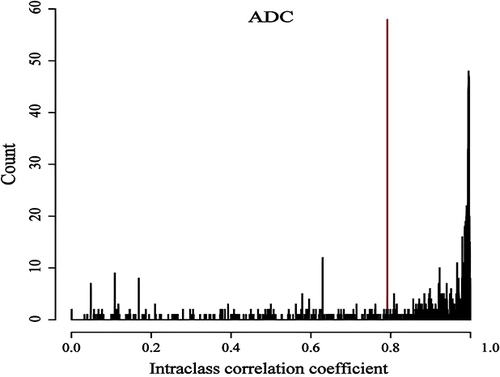
Figure 4 The ICC of FS-T2WI.
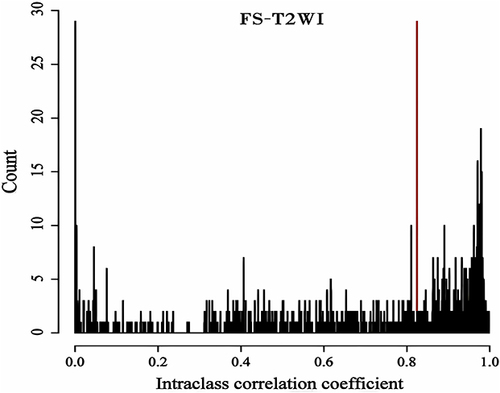
Table 3 Performance of Each Model in Training Set and Test Set
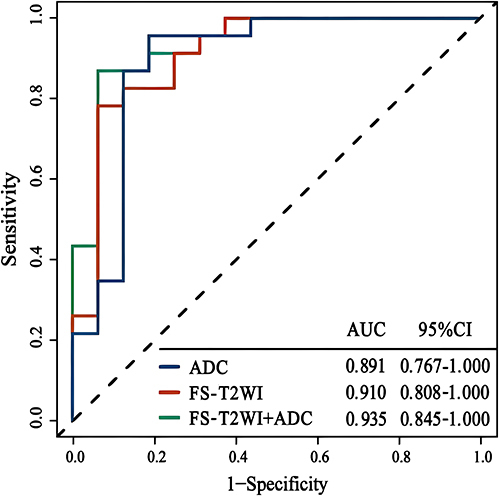
Figure 5 ROC curve analysis of the training set in between the stage III type 2 DKD and normal subjects. The solid lines in different colors indicate that the ROC curve for each model correspond to a different AUC.
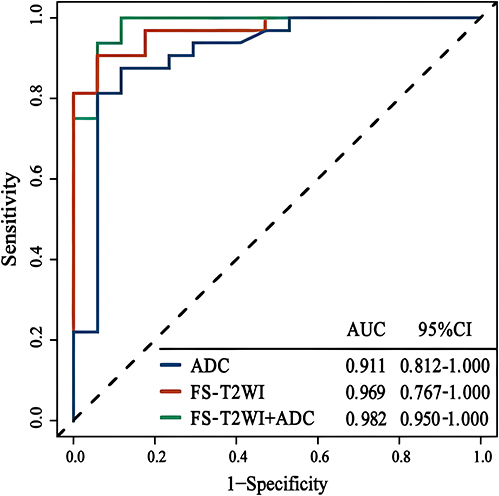
Figure 6 ROC curve analysis of the test set between the stage III type 2 DKD and normal subjects. The solid lines in different colors indicate that the ROC curve for each model correspond to a different AUC.