Figures & data
Table 1 Baseline and Follow Up Laboratory Findings at 6 and 12 Months
Figure 1 Body weight trend over one year of follow-up.
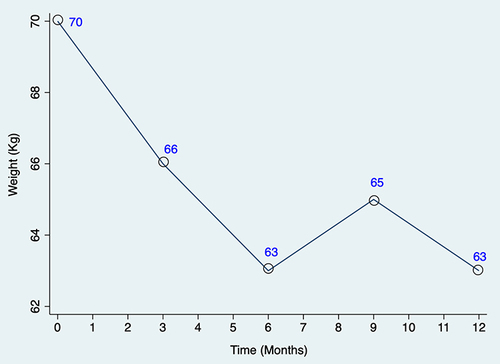
Figure 2 HBA1C trend over one year of follow-up.
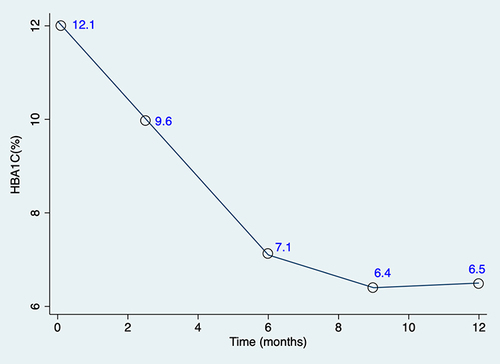
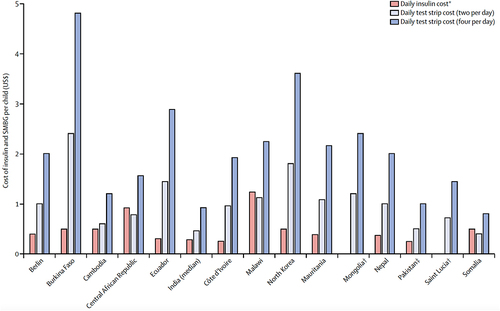
Figure 3 Direct costs of insulin and self-monitoring of blood glucose for families in low-income and middle-income countries.Citation2
Notes: Data are from the World Health Organization (WHO Diabetes Country Profiles 2016) and are the typical supply costs for a family with one child with type 1 diabetes. *The amount of insulin required was assumed to be 18 vials of 100 IU/mL human insulin (or equivalent volume of 40 IU/mL). †Government provides insulin for free. ‡Cost updated from previous data.
Abbreviation: SMBG, self-monitoring of blood glucose.