
Figures & data
Table 1 Descriptive Characteristics of Barbara Davis Study Participants with Type 1 Diabetes, Mean ± Std or % (n)
Table 2 Descriptive Characteristics of Barbara Davis Study Participants with Type 1 Diabetes, Stratified by Race/Ethnicity, Mean ± Std or % (n)
Table 3 Descriptive Characteristics of the Participants, Stratified by Race and Age Group, Mean ± Std or % (n)
Table 4 Multivariable Adjusted Relationship of Race/Ethnicity with Technology Use in Type 1 Diabetes, Stratified by Age Group
Table 5 Race Stratified Multivariable Adjusted Factors Associated with Technology Use in the Pediatric Population
Table 6 Race/Ethnicity Stratified Multivariable Adjusted Factors Associated with Technology Use in the Adult Population
Figure 1 Mean multivariable adjusted HbA1c by race/ethnicity and technology use. Mean HbA1c by race/ethnicity and diabetes technology use: 1) pediatric population; 2) adult population. Mean HbA1c by race/ethnicity and CGM use: 3) pediatric population; 4) adult population. Mean HbA1c by race/ethnicity and CSII use: 5) pediatric population; 6) adult population. Analyses adjusted for age, diabetes duration, and number of provider visits over the past year. *p<0.05, **p<0.01, ***P<0.001, ****p<0.0001 for differences by any technology (panels 1 and 2), CGM (panels 3 and 4) or CSII use (panels 5 and g).ap<0.05, cp<0.001, dp<0.0001 for differences by race.
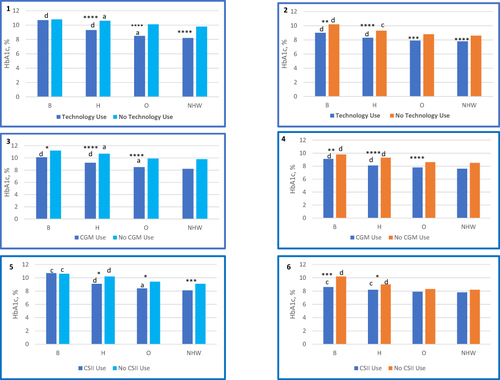
Figure 2 Mean multivariable adjusted HbA1c by race/ethnicity and Automated Insulin Delivery Systems (AID) use in the pediatric and adult patient populations at the Barbara Davis Center. Analyses adjusted for age, diabetes duration, and number of provider visits over the past year. *p<0.05, **p<0.01, ***p<0.001 for differences by AID use. ap<0.05, bp<0.01, cp<0.001, dp<0.0001 for differences by race.
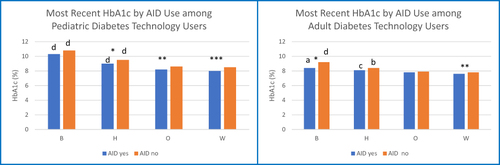
Table 7 Multivariable Adjusted Association of Technology Use with Diabetic Ketoacidosis in the Past Year