Figures & data
Figure 1 Patient flow diagram.
Abbreviations: CT, computed tomography; HCC, hepatocellular carcinoma; MAFLD, metabolic dysfunction-associated fatty liver disease; MRI, magnetic resonance imaging; PSM, propensity score matching.
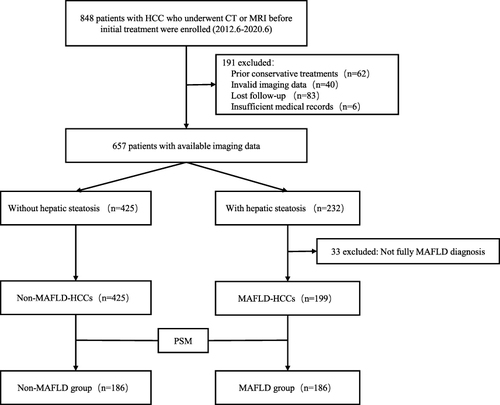
Table 1 Baseline Characteristics of Total Cohort and PSM Cohort
Figure 2 (A) OS before matching. (B) OS after matching. (C) OS in patients with hepatitis B after matching. (D) OS in patients without hepatitis B after matching.
Abbreviations: HCC, hepatocellular carcinoma; MAFLD, metabolic dysfunction-associated fatty liver disease; OS, overall survival.
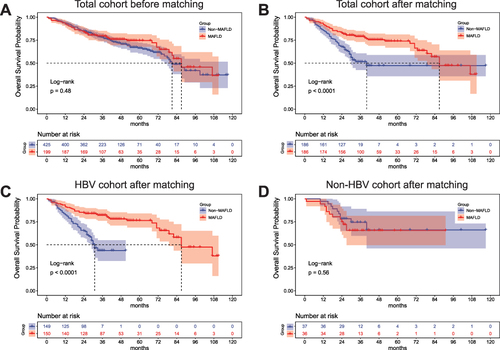
Figure 3 (A) Patients with MAFLD stratified by HBeAg status. (B) Patients with MAFLD stratified by HBV DNA levels. (C) Patients with non-MAFLD stratified by HBeAg status. (D) Patients with non-MAFLD stratified by HBV DNA levels.
Abbreviations: CHB, chronic hepatitis B; HCC, hepatocellular carcinoma; MAFLD, metabolic dysfunction-associated fatty liver disease; HBeAg, hepatitis B e-antigen; HBV, hepatitis B virus.
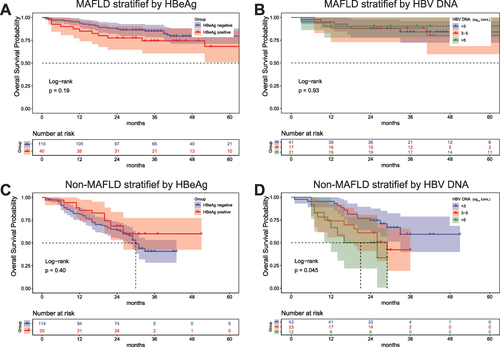
Table 2 Prognostic Factor Analysis for Overall Survival in CHB-HCC Patients
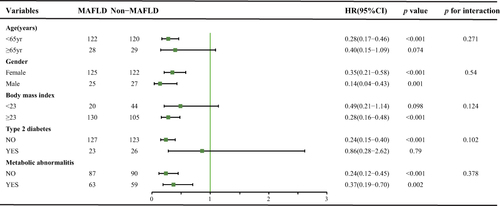
Figure 4 Subgroup analyses by two groups of non-MAFLD and MAFLD after matching.
Abbreviations: HR, hazard ratio; MAFLD, metabolic associated fatty liver disease.