Figures & data
Figure 1 Date cleaning procedure. After excluding participants aged not 20–80 years, missing value, and using antilipemic agents, there were 3221 participants including the current analysis.
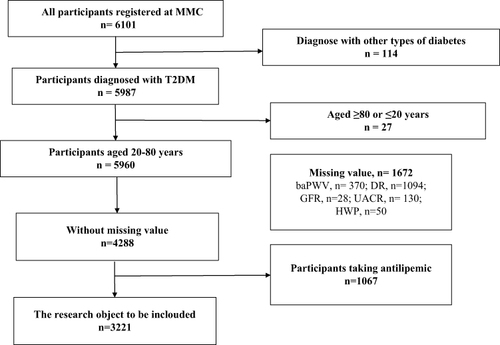
Table 1 Demographic Information and Clinical Character of the Present Study
Table 2 Logistic Regression Analysis Assessing the Associations Between the Hypertriglyceridemic-Waist Phenotype and Vascular Complication Index of Diabetes
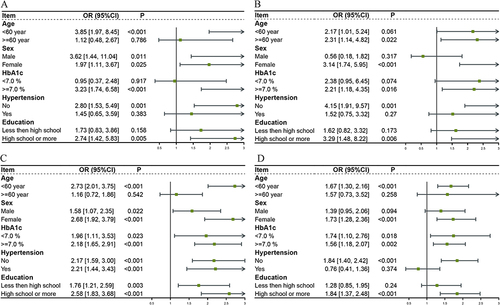
Figure 2 Stratified analysis of associations between the hypertriglyceridemic-waist phenotype and vascular complication index of diabetes. (A) ABI (B) GFR (C) UACR (D) baPWV.
Abbreviations: DR, Diabetic retinopathy; GFR, Glomerular filtration rate; ABI, ankle-brachial index; baPWV, Brachial-ankle pulse wave velocity.