Figures & data
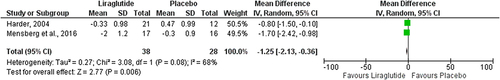
Figure 1 PRISMA 2020 flow diagram of the selection process. *The total number of records identified using the keywords “Glucagon-like peptide-1 receptor agonists or GLP-1 or liraglutide or Saxenda” and “body composition or fat mass or fat-free mass or obesity” and “type 2 diabetes” from all databases (Web of Science, Cochrane, and Pubmed) was 5196. **All excluded records were excluded manually by three independant reviewers.
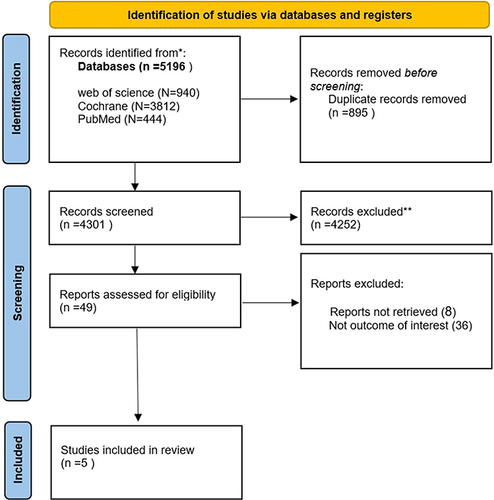
Table 1 Summary of RCT Studies
Table 2 Summary of Observational Studies
Figure 2 Risk of bias summary for RCTs. Red (-) high risk of bias; yellow (?) unclear risk of bias green (+) low risk of bias.
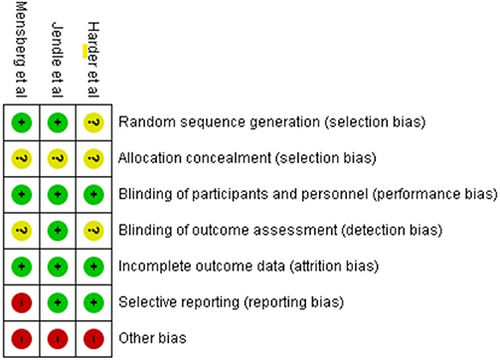
Figure 3 Forest plot of mean change in body fat (%) according to liraglutide and placebo.
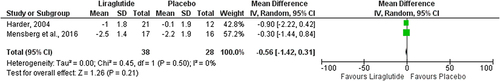
Figure 4 Forest plot of mean change in weight (%) according to liraglutide and placebo.
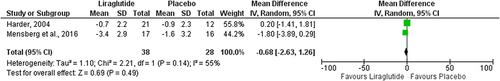
Figure 5 Forest plot of mean change in Hba1c (%) according to liraglutide and placebo.