Figures & data
Figure 1 Study flowchart.
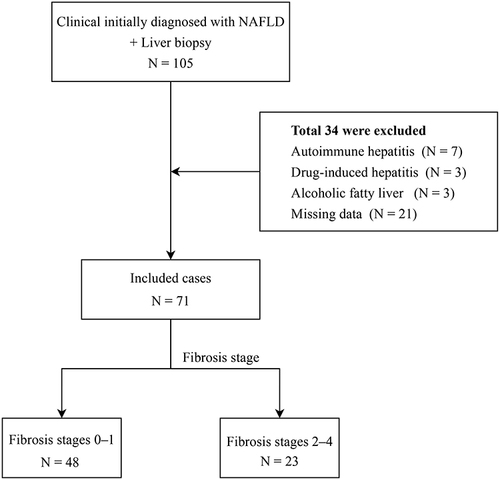
Table 1 Clinical Features of Patients
Table 2 Results of Univariate and Multivariate Analysis for Prediction of Significant Fibrosis
Table 3 Performance Assessment of Our Developed Nomogram Model and Other Variables (IV-C, CHI3L1, LSM, APRI and FIB-4) for the Prediction of Significant Fibrosis
Table 4 The Comparation of AUROCs of IV-C, CHI3L1, LSM, APRI, FIB-4, and Nomogram for the Detection of Significant Fibrosis
Figure 2 Receiver operating characteristics (ROC) curves for predicting significant fibrosis.
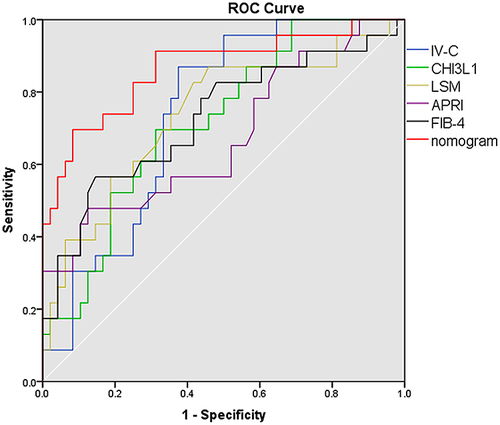
Figure 3 Nomogram: A nomogram was created to predict significant fibrosis in NAFLD.
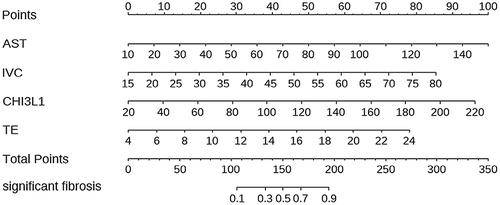
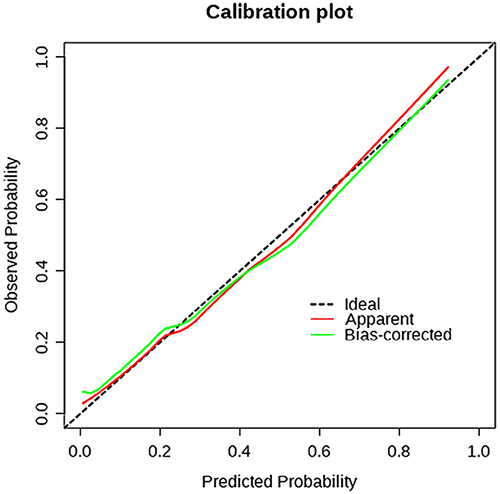
Figure 4 The calibration curves for nomogram (1000 bootstrap resamples) for predicting significant fibrosis in NAFLD. Nomogram-predicted probability of significant fibrosis is plotted on the x-axis; actual probability is plotted on the y-axis.