
Figures & data
Table 1 Baseline Demographics and Clinical Characteristics in COVID-19 Patients with T2D Stratified by Metformin
Table 2 Laboratory Parameters of COVID-19 Patients with T2D in the Metformin and Non-Metformin Groups
Table 3 Treatment and Clinical Outcome in T2DM Patients Between the Metformin and Non-Metformin Groups
Figure 1 Kaplan-Meier Survival Curves for patients with COVID-19 and T2D with and without Metformin treatment.
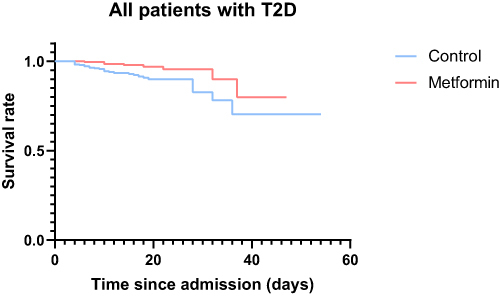
Table 4 Hazard Ratios for Primary and Secondary Outcomes Between Individuals in the Metformin and the Non-Metformin Groups