
Figures & data
Figure 1 Flowchart of the participants’ recruitment.
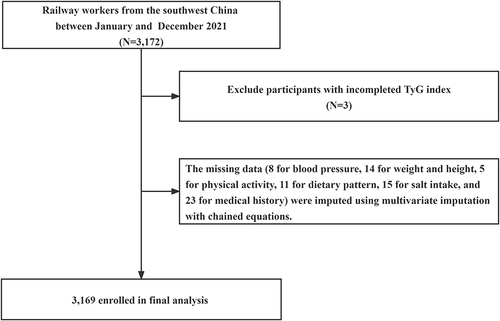
Table 1 General Characteristics of the Study Participants According to the TyG Index
Table 2 Association Between the TyG Index and CAP
Figure 2 Multivariate-adjusted association of the TyG index and CAP based on restricted cubic splines. The OR was decreased at the TyG of 9.64; ORs were adjusted for age, SBP, DBP, MAFLD, physical activity, smoking, drinking, salt intake, dietary pattern; the Grey shadow represents 95% CI confidence interval.
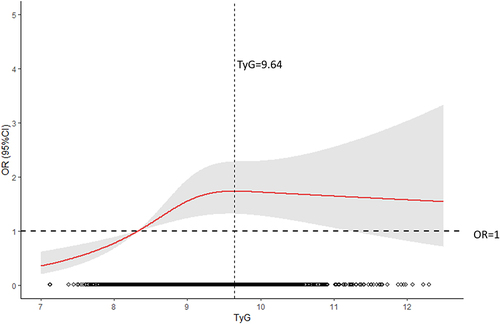
Figure 3 ROC curves for different models in predicting CAP detection. Model 1: adjusted for age, SBP, DBP. Model 2: adjusted for age, SBP, DBP, BMI. Model 3: adjusted for age, SBP, DBP, BMI, physical activity, smoking, drinking, salt intake, dietary pattern.
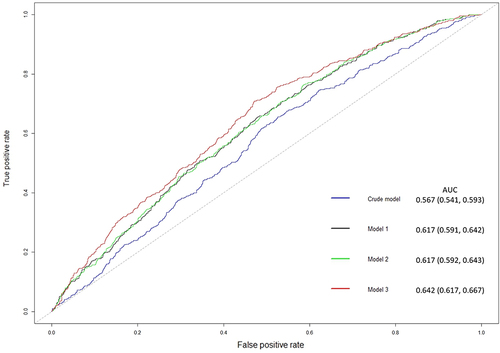
Table 3 Subgroup Analysis for Association Between the TyG Index and CAP
Table 4 Sensitivity Analysis for Association Between the TyG Index and CAP After Excluding Participants with Hypertension, Diabetes, Dyslipidemia