
Figures & data
Figure 1 Alpha diversity analysis. (A) Rarefaction curves of Sobs index; (B) rarefaction curves of Shannon index; (C–G) Differences in alpha diversity indices between groups.
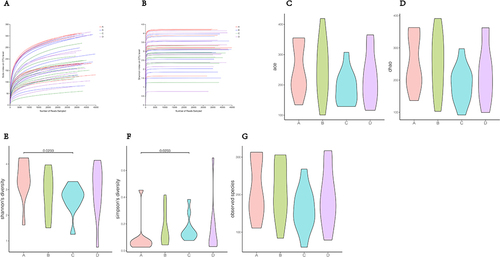
Figure 2 Distribution of gut microbiota species at phylum (A), class (B), order (C), family (D), genus (E) and species (F) levels.
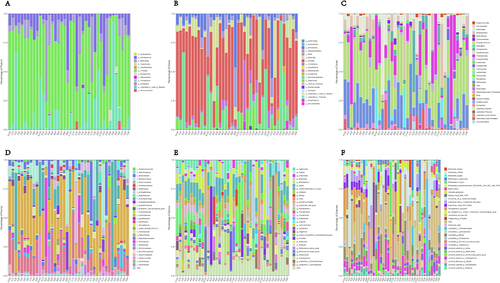
Table 1 P values of Richness of Gut Microbiota with Statistical Difference
Figure 3 Bar graph of gut microbiota with statistically differential richness.
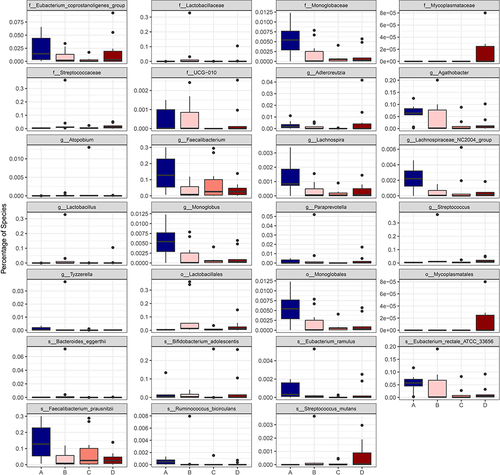
Figure 4 PCA scores of fecal metabolome.
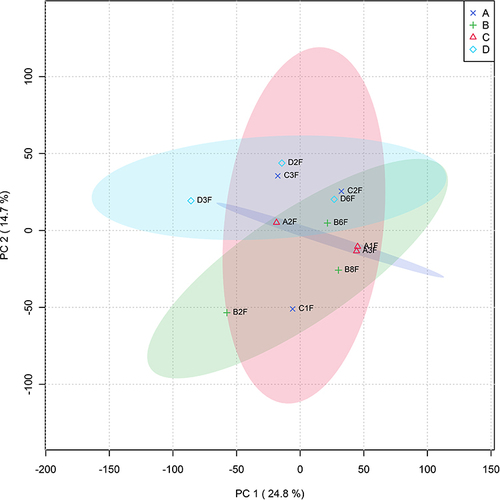
Figure 5 OPLS-DA analysis of fecal metabolites: result of permutation tests.
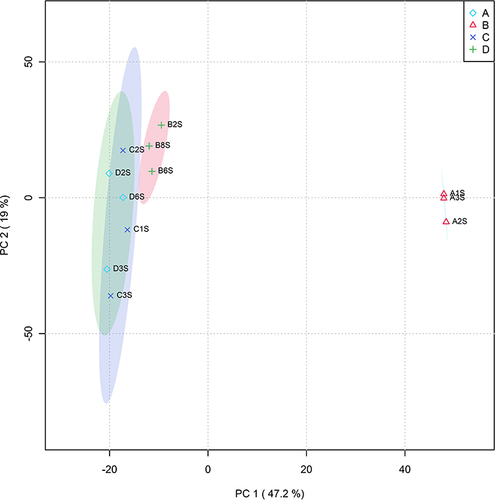
Figure 6 Heat map of differential metabolites in stool.
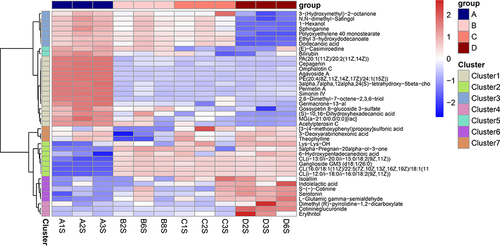
Figure 7 Compound expressions in cluster 1 of differential metabolites in stool.
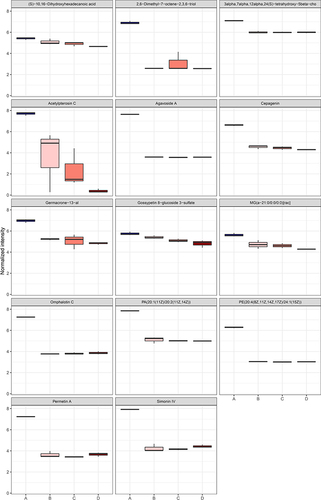
Figure 8 Compound expressions in cluster 2 of differential metabolites in stool.
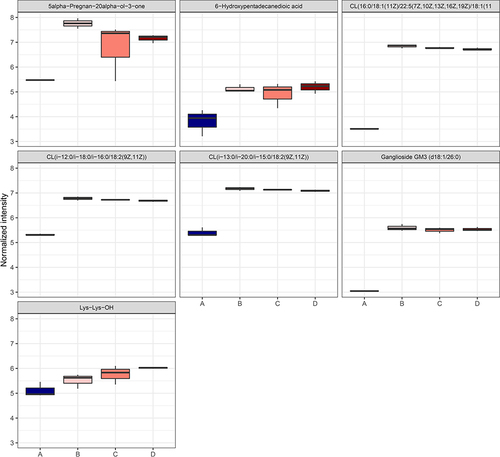
Figure 9 Compound expressions in cluster 3 of differential metabolites in stool.
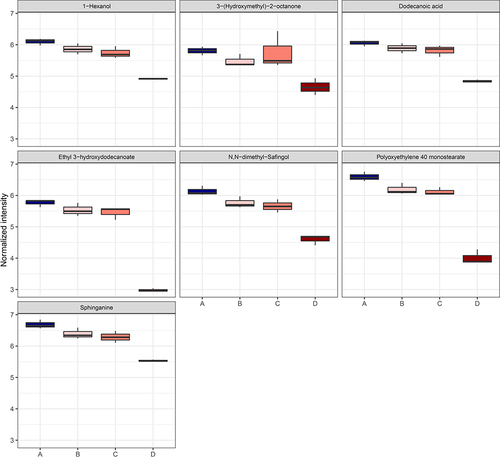
Figure 10 Compound expressions in cluster 4 of differential metabolites in stool.
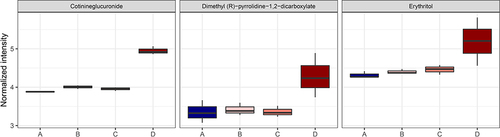
Figure 11 Correlation between metabolites and S16S between group B and group C. *P < 0.05; **P < 0.01; ***P < 0.001.
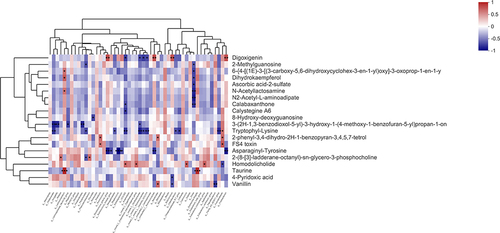
Figure 12 Correlation between metabolites and metagenomic analysis between group B and group C. *P < 0.05; **P < 0.01; ***P < 0.001.
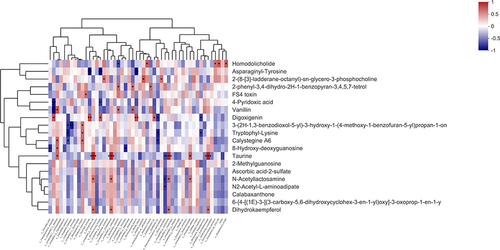
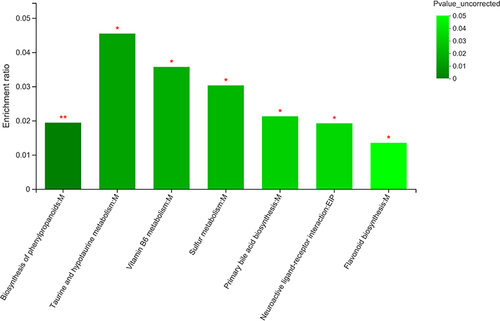
Figure 13 KEGG enrichment analysis between group B and group C. *P < 0.05; **P < 0.01.
Data Sharing Statement
All data generated or analysed during this study are included in this article. Further enquiries can be directed to the corresponding author.