Figures & data
Figure 1 Body weight and blood glucose of diabetic rats and the expression of AGE and RAGE in the atrium. (A) Changes in body weight of two groups of rats in 0 week and 8 week (n=12). (B) Blood glucose changes in two groups of rats before and after modeling (n=12). (C) Representative blots of AGE and RAGE proteins in atrium of diabetic rat (n=6). (D) Densitometry analysis of AGE and RAGE proteins in atrium of diabetic rat (n=6). *p<0.05, #p>0.05.
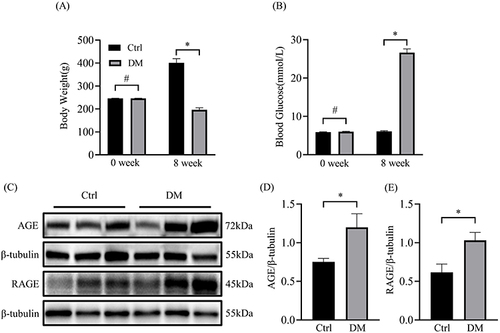
Figure 2 Expression of Cx43 and Cx40 proteins in atrial tissues from Control and Diabetic groups. (A) Representative blots of Cx43 and Cx40 proteins in atrium of diabetic rat (n=6). (B and C) Densitometry analysis of Cx43 and Cx40 proteins in atrium of diabetic rat (n=6). (D) Representative histological fixed sections of atrial tissues stained with Immunohistochemistry. *p<0.05.
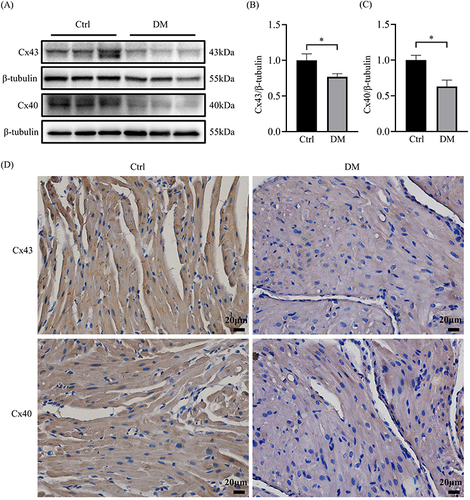
Figure 3 Altered protein expression levels of Cx43 and Cx40 in HL-1 cells and primary atrial myocytes treated with AGEs. (A) Representative blots of Cx43 and Cx40 proteins in each HL-1 cell group (n=6). (B and C) Densitometry analysis of Cx43 and Cx40 proteins in each HL-1 cell group (n=6). (D) Representative blots of Cx43 and Cx40 proteins in each primary rat atrial myocyte group (n=6). (E and F) Densitometry analysis of Cx43 and Cx40 proteins in each primary rat atrial myocyte group. *p<0.05.
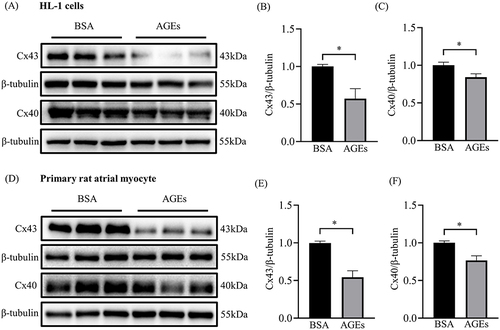
Figure 4 Inactivation of AMPK in atrial of diabetic rats and AGEs treated atrial cells. (A) Representative blots of p-AMPK (n=6) and AMPK proteins (n=12) in atrium of diabetic rat. (B and C) Densitometry analysis of p-AMPK (n=6) and AMPK (n=12) proteins in atrium of diabetic rat. (D) Representative blots of p-AMPK and AMPK proteins in each HL-1 cell group (n=6). (E and F) Densitometry analysis of p-AMPK and AMPK proteins in each HL-1 cell group (n=6). (G) Representative blots of p-AMPK and AMPK proteins in each primary rat atrial myocyte group (n=6). (H and I) Densitometry analysis of p-AMPK and AMPK proteins in each primary rat atrial myocyte group (n=6). *p<0.05, #p>0.05.
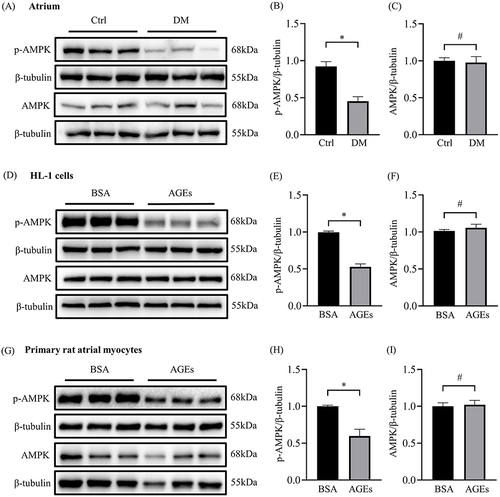
Figure 5 Effects of AMPK activation on AGEs-induced Cx43 and Cx40 alteration in atrial cells. (A) Representative blots of p-AMPK, AMPK, Cx43 and Cx40 proteins in each cell group (n=6-9). (B-E) Densitometry analysis of p-AMPK, AMPK, Cx43 and Cx40 proteins in each cell group (n=6-9). *p<0.05, #p>0.05.
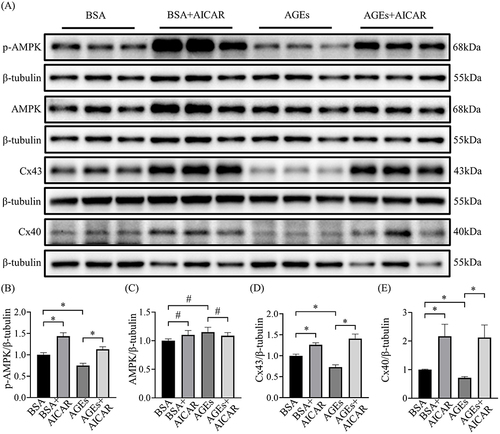
Figure 6 Decreased expression of Cx43 and Cx40 by downregulation of AMPK. (A) Representative blots of AMPK, Cx43 and Cx40 proteins in HL-1 cells transfected with AMPK α1 siRNA (n=6-9). (B-D) Representative densitometry analysis of AMPK, Cx43 and Cx40 proteins in HL-1 cells transfected with AMPK α1 siRNA (n=6-9). (E) Representative blots of AMPK, Cx43 and Cx40 proteins in HL-1 cells transfected with AMPK α2 siRNA (n=6-9). (F-H) Representative densitometry analysis of AMPK, Cx43 and Cx40 proteins in HL-1 cells transfected with AMPK α2 siRNA (n=6-9). *p<0.05.
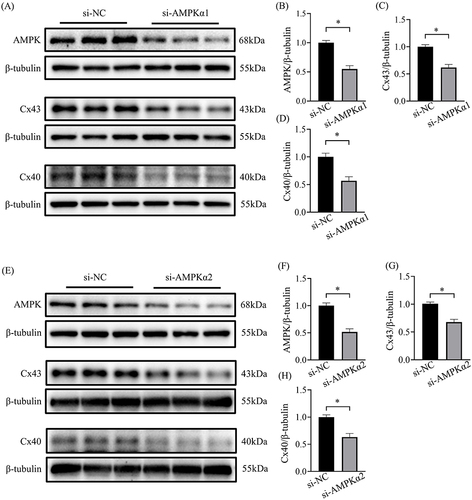
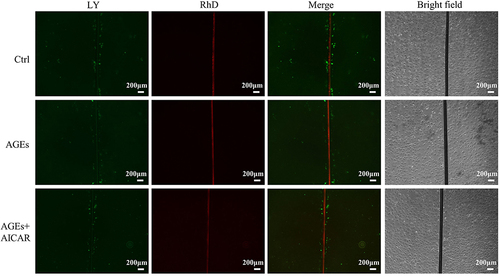
Figure 7 AMPK activation diminished AGEs-induced gap junctional dysfunction in primary atrial myocytes. Representative images of fluorescein yellow (LY) and rhodamine (RD) diffusion in each group of cells indicate lower diffusion through gap junctions in the AGEs group and increased diffusion in the AICAR group compared to the AGEs group.