
Figures & data
Table 1 Baseline Characteristics of Participants with Proliferative Diabetic Retinopathy
Table 2 Univariate Linear Regression Analysis of SFCT in Participants with Proliferative Diabetic Retinopathy
Table 3 Relationship Between Lipid Profile and SFCT in Participants with Proliferative Diabetic Retinopathy
Figure 1 Smooth curve fitting between lipid profile and SFCT in patients with proliferative diabetic retinopathy. (A–D) present the tendency between total cholesterol, HDL-C, LDL-C, triglyceride, and SFCT, respectively.
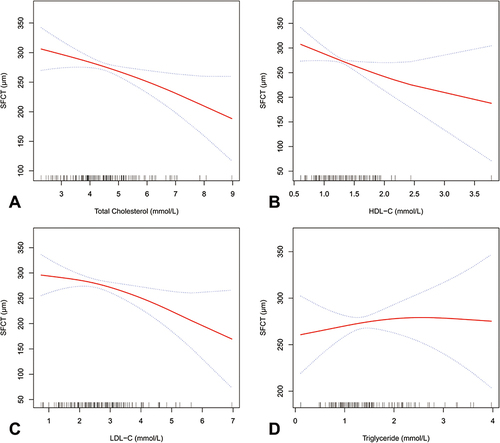
Table 4 The Results of Stratified Analysis in Participants with Proliferative Diabetic Retinopathy