Figures & data
Table 1 Expression Levels for Up-Regulated Genes According to Primary Gene Ontology Function
Table 2 Expression Levels for Down-Regulated Genes According to Primary Gene Ontology Function
Figure 1 The differential gene expression between BPH and control rats (A) displays a heatmap comprising the DEGs enriched in proliferation and mitochondrial-related genes. The color bars on the top of the heatmap indicate these enriched categories. The color scale represents the log2 fold change of gene expression. (B) presents the KEGG analysis of the DEGs. This panel shows the top 10 enriched pathways based on their adjusted p-value. The color of the bars represents the enrichment score, and the number of DEGs in each pathway is indicated. Based on the KEGG analysis, the potential mechanisms and signaling pathways associated with BPH were identified. (C and D) presents a volcano plot and heatmap of the top 10 upregulated and top 10 downregulated target genes of the differentially expressed genes (DEGs) in a rat model of BPH. Among the top target genes, Sult1c2a, Ccng1, Ifit1, RT1-Bb, Senp5, Sult1c2b, Aqp2, Dmkn, Cdk17, Cdo1, and Mcoln2 were found to be upregulated, while Defb50, Ascl5, Slc38a11, Svs3a, Atp12a, Cd52, Mt3, Msmb, and Rap2ip were identified as downregulated in the BPH rats compared to the control group. The volcano plot, with the x-axis representing the log2 fold change and the y-axis the -log10 adjusted p-value, revealed that the downregulated genes were greater in number than the upregulated genes when compared to the control group, based on predefined cut-offs for fold change (>1.5 or <-1.5) and adjusted p-value (<0.05). The upregulated genes are represented by red dots, while the downregulated genes are represented by green dots, as shown by the dashed lines.
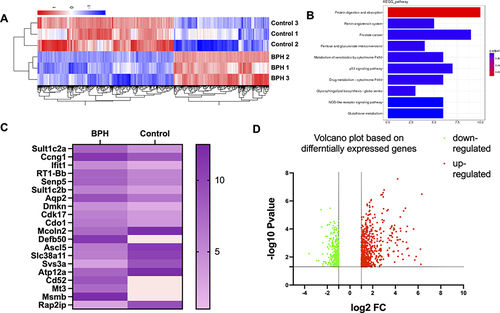
Figure 2 Leptin enhances the viability and proliferation of prostatic stromal cells. (A and B) EdU assay was performed to measure the proliferation of prostatic stromal cells treated with different concentrations of leptin (0, 25, 50 ng/mL) for 24 h. The results showed that leptin significantly increased the proliferation ratio of prostatic stromal cells at 25 ng/mL, but not at other concentrations. Data are presented as mean ± SD of three independent experiments. *P < 0.05, **P < 0.01 compared with control group. (C) CCK-8 assay was performed to measure the viability of prostatic stromal cells (WPMY-1) treated with different concentrations of leptin (0, 6.25, 12.5, 25, 50, and 100 ng/mL) for 24 h. The results showed that leptin significantly increased the viability of prostatic stromal cells in a dose-dependent manner.
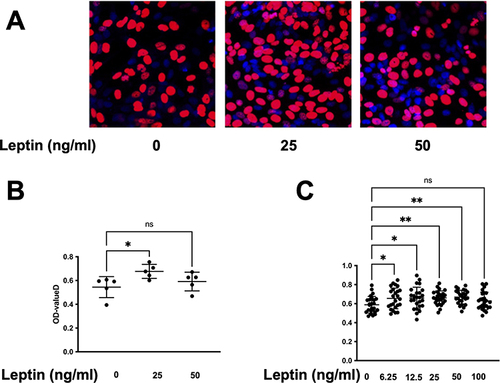
Figure 3 Effect of leptin on EFS-induced contraction of prostate strips and stromal cells. (A and B) Prostate strips were incubated with either 50 ng/mL or 100 ng/mL leptin for 30 min before being stimulated with EFS at 16 Hz. The amplitude of the contraction was measured and normalized to the initial response. Leptin significantly enhanced the contraction of prostate strips at 100 ng/mL compared to the control group (*p < 0.05). Data are presented as mean ± SEM of five independent experiments. (C) Leptin induces stromal cell contraction. Stromal cells were cultured in collagen gels and treated with leptin (25 ng/mL) or vehicle for 24 h in standard 24-well-plates. Quantification of gel contraction expressed as percentage of initial area. (D) Data are mean ± SEM of three independent experiments. (*p < 0.05), compared to vehicle control by One-way ANOVA. Control vs BDM: p=0.0017; Control vs Leptin: p=0.0451. (**p < 0.01).
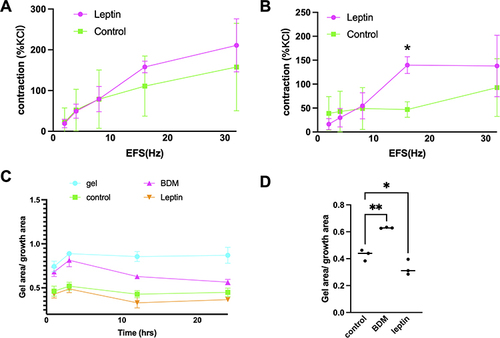
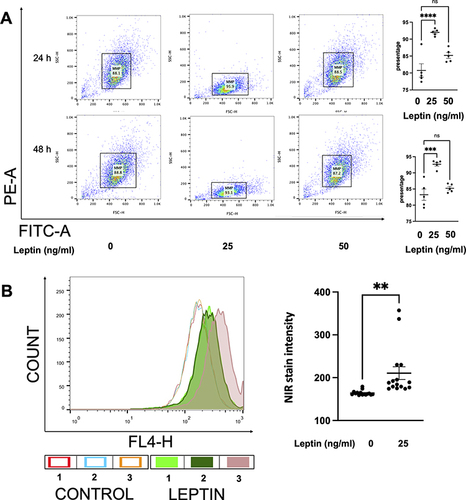
Figure 4 The assessment of mitochondrial-related apoptosis of prostatic stromal cells by NIR and JC-10 dye. (A) shows the changes in the mitochondrial associated apoptosis in WPMY-1 cells based on JC-10 fluorescence intensity. Leptin enhanced the green fluorescence intensity of JC-10 aggregates, which means leptin downregulates the mitochondrial associated apoptosis. FACS analysis was carried out, analysing 10,000 cells per group. Data are mean ± SEM of five independent experiments. (***p < 0.001, ****p < 0.0001), compared to vehicle control by ordinary one-way ANOVA test. (B) reflects the activity of the ∆ψM in WPMY-1 cells based on NIR dye staining. After 24 h of incubation, leptin (25 ng/mL) increased the number of NIR-positive cells, indicating a protective effect on ∆ψM. Data are mean ± SEM of five independent experiments. (**p < 0.005), compared to vehicle control by Student’s t-test.