
Figures & data
Table 1 Baseline Characteristics of Patients According to PNI
Figure 1 Flow chart of study participant screening.
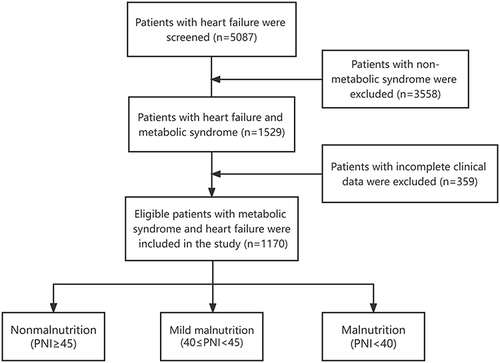
Table 2 Univariate and Multivariate Linear Regression Analysis for PNI
Table 3 Unadjusted and Adjusted Cox Regression Analyses for Adverse Outcomes
Figure 2 Kaplan‒Meier analyses of adverse outcomes categorized by PNI. (A) All-cause death. (B) Cardiovascular death.
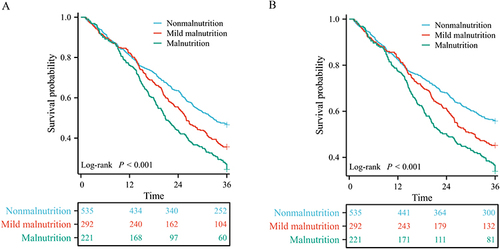
Figure 3 Restricted cubic splines visualize the association between PNI and adverse outcomes in patients with metabolic syndrome and heart failure. (A) All-cause death. (B) Cardiovascular death.
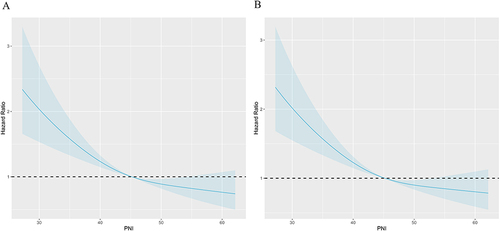
Table 4 Prognostic Predictive Value of Different Indicators
Table 5 Prognostic Predictive Value of Different Models
Table 6 Prognostic Value of PNI for All-Cause Death in Various Subgroups