
Figures & data
Table 1 Inclusion and Exclusion Criteria
Table 2 Comparison of Clinical Characteristics and Anthropometric Features
Table 3 Comparison of Biochemical Analysis Between the Groups
Figure 1 Subgroup analysis between KPT2DM and T2D groups. P = 0.026. *P<0.05.
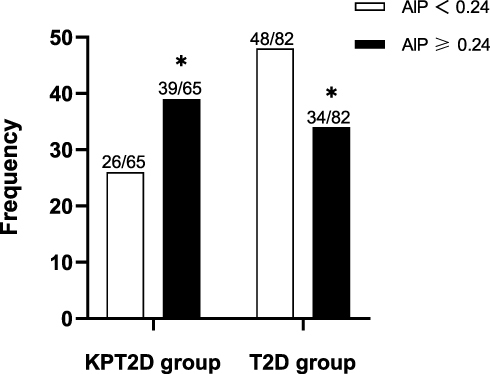
Figure 2 Correlation Analysis of Plasma Ketones and AIP in Patients with KPT2D. R = 0.345 P = 0.023.
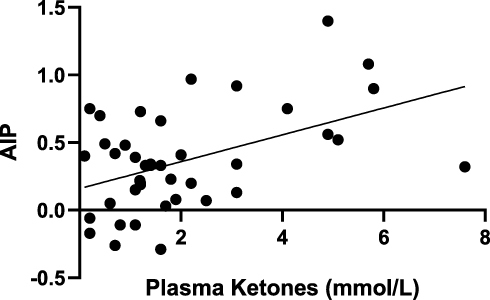
Figure 3 (A) Correlation Analysis of Plasma Ketones and ApoA1 in Patients with KPT2D. R = −0.460 P = 0.002. (B) Correlation Analysis of Plasma Ketones and ApoB in Patients with KPT2D. R = −0.142 P = 0.363.
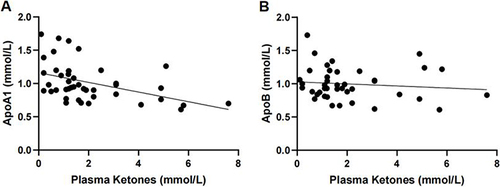
Table 4 Parameters of the Binary Logistic Regression Model
Table 5 Multiple Linear Regression of AIP and Relevant Indicators in KPT2D Patients
Table 6 Multiple Linear Regression of apoA1 and Relevant Indicators in KPT2D Patients