
Figures & data
Table 1 Comparison of Baseline Data Between the Two Groups of Patients
Table 2 Comparison of Clinical Treatment Efficacy Between the Two Groups of Patients
Figure 1 Comparison of blood glucose indicators between the two groups of patients. (A) FPG levels. (B) 2hPG levels. (C) HbAlc levels.
Note: *Means comparison P<0.05.
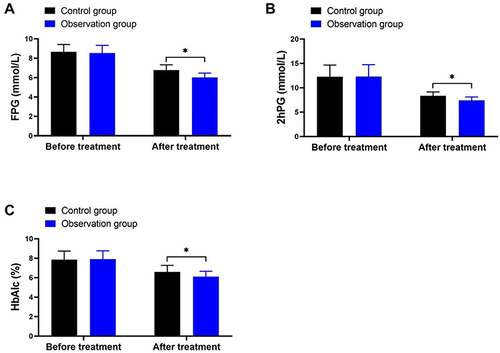
Figure 2 Comparison of renal function indicators between the two patient groups. (A) Scr levels. (B) BUN levels. (C) UmAlb levels. (D) UAER levels. (E) UACR levels. (F) 24h urine protein quantification level.
Note: *Indicates comparison P<0.05.
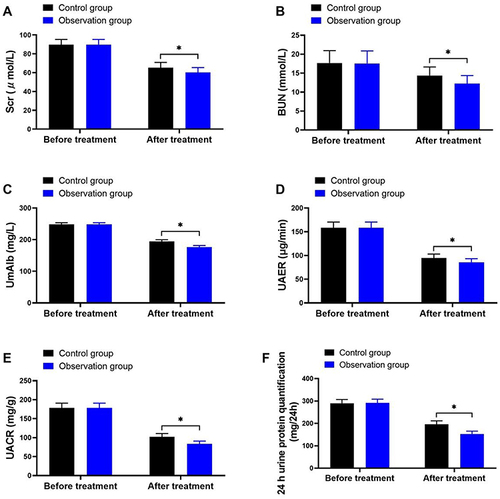
Figure 3 Comparison of inflammatory marker indices between two groups of patients. (A) Levels of hs-CRP. (B) Levels of IL-1β. (C) Levels of TNF-α.
Note: *Indicates comparison P<0.05.
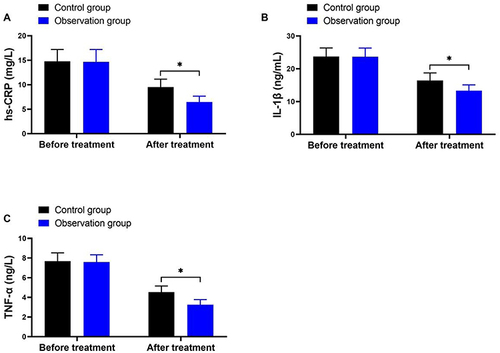
Table 3 Comparison of Adverse Reactions Between the Two Groups