Figures & data
Table 1 General Characteristics and Outcomes of the Included Studies Among Type 2 Diabetic Adult Patients
Figure 1 PRISMA 2020 Flow chart to describe the selection of studies for the systematic review and meta-analysis on the global prevalence of anemia among T2DM adult patients.
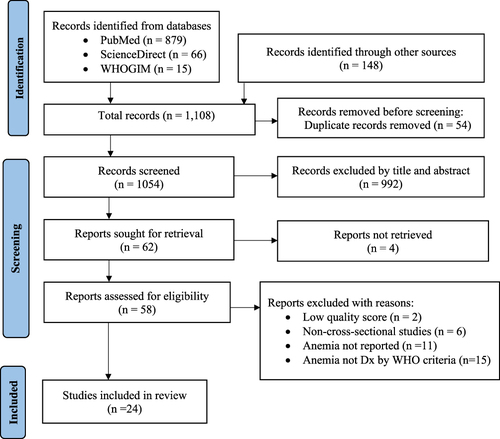
Figure 2 A forest plot showing the individual study and pooled prevalence of anemia among T2DM adult patients.
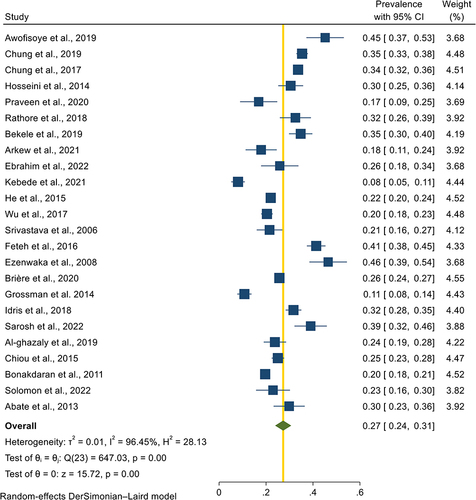
Figure 3 Predictive interval for population prevalence of anemia among T2DM adult patients.
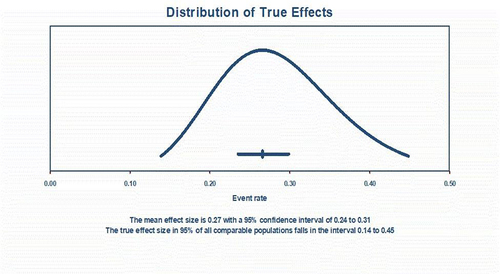
Table 2 Subgroup Analyses Showing Pooled Prevalence of Anemia Among Type 2 Diabetic Adult Patients
Figure 4 Sensitivity analysis showing the prevalence of anemia among T2DM adult patients.
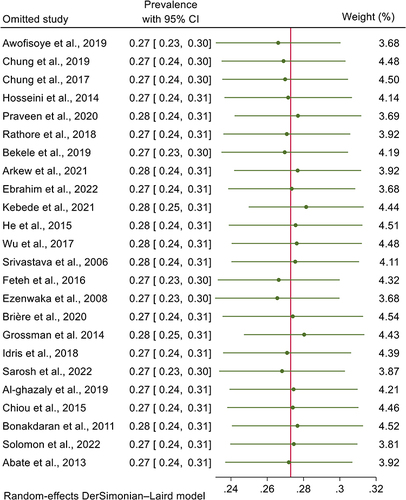
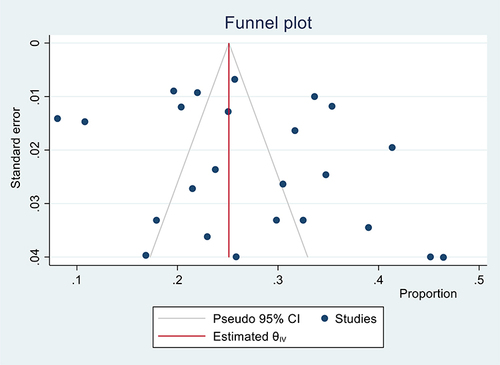
Figure 5 Funnel plot depicting publication bias for the prevalence of anemia among T2DM adult patients.