Figures & data
Figure 1 Changes and comparison of body weight of rats in different experimental groups. (A) Weight change between blank and model groups (n=14, n=44). Compared to the blank group, #P < 0.05, ##P <0.01, (B) the weight changes in the Letrozole group, metformin group, pioglitazone group and acarbose group, (C) the delta of weight change in each group, n=8 for each group. Values were presented as the mean±SEM (Data were analyzed for statistically significant differences using two-way ANOVA followed by Bonferroni post hoc test.).
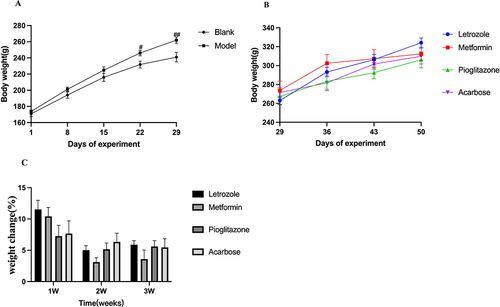
Figure 2 Comparison of glucose homeostasis in rats of different experimental groups. (A) Results of Intraperitoneal glucose tolerance test in each group, n=8, compared with the blank group, ##P <0.01, compared with the letrozole group, *P<0.05, **P<0.01, Values were presented as the mean±SEM (The data are non-normally distributed repeated measurements, Generalized linear estimating equation was used). (B) AUCs of rats in each group, n=8 for each group. Values were presented as the mean±SEM (Data were analyzed for statistically significant differences using one-way ANOVA). (C) FINS of rats in each group, n=8 compared with the blank group, #P <0.05, compared with the letrozole group, *P<0.05, **P<0.01, Values were presented as the mean±SEM (Data were analyzed for statistically significant differences using one-way ANOVA followed by Dunnett post hoc test). (D) HOMA-IR of rats in each group, n=8. Values were presented as the mean±SEM (Data were analyzed for statistically significant differences using one-way ANOVA followed by Tukey post hoc test) compared with the blank group, ###P<0.001, compared with letrozole group,***P<0.001.
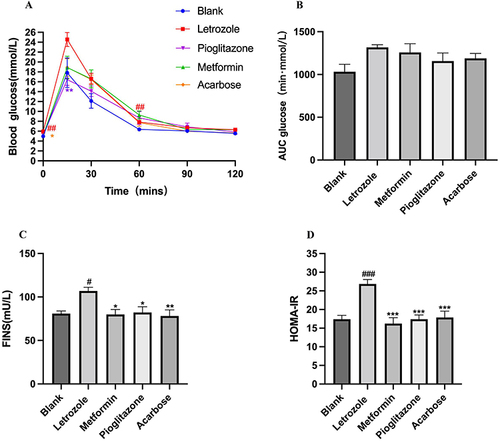
Figure 3 Changes of estrus cycle of rats in each group. The change of estrus cycle in the blank group showed regular changes in proestrus, estrus, metestrus and diestrus. Estrus cycle changes in model group, presenting continuous diestrus. After the drug intervention, changes of estrus cycle of rats in each group (4 rats were selected for demonstration.).
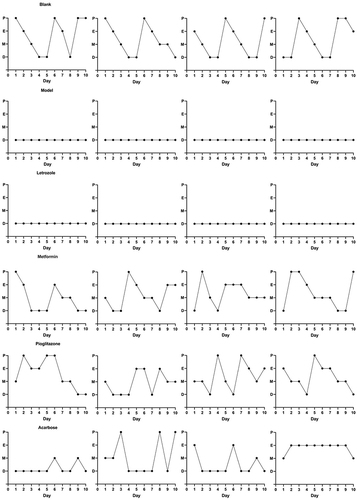
Table 1 Comparison of Estrous Cycle and Ovary Morphology in Each Group
Figure 4 Ovary morphology of rats in each group. (a) Ovary morphology of rats in the blank group (n=6), (b) Ovary morphology of rats in the model group (n=12). After the drug intervention, morphological changes of ovarian tissue of rats in each group (100x, (c) Ovary morphology of rats in the blank group (n=8); (d) Ovary morphology of rats in the Letrozole group (n=8); (e) Ovary morphology of rats in the pioglitazone group (n=8); (f) Ovary morphology of rats in the acarbose group (n=8); (g) Ovary morphology of rats in the metformin group (n=8).).
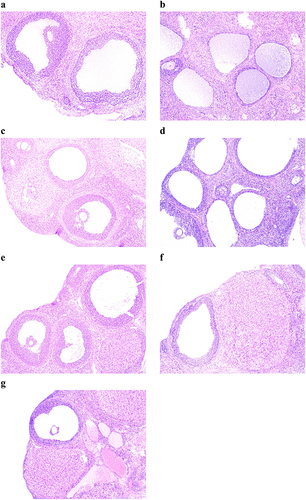
Figure 5 Comparison of ovarian index in each group, n=8 values were presented as the mean±SEM (Data were analyzed for statistically significant differences using one-way ANOVA followed by Dunnett post hoc test). Compared with the blank group, ##p< 0.01, compared with the Letrozole model group, *P< 0.05, **P< 0.01 ***P< 0.001.
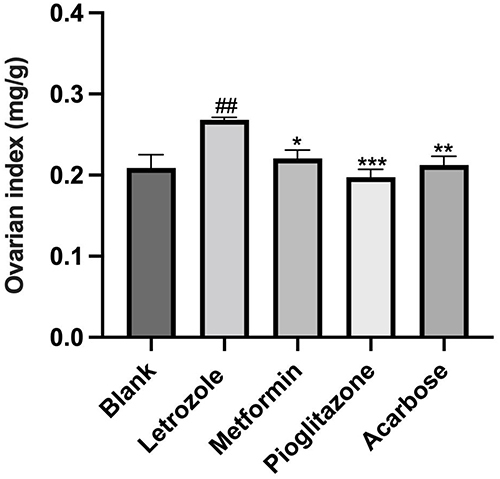
Figure 6 Comparison of sex hormone levels in each group, n=8 values were presented as the mean±SEM. (A) Testosterone level of rats in each group (Data were analyzed for statistically significant differences using one-way ANOVA followed by Tukey post hoc test); (B) Luteinizing hormone level of rats in each group (Data were analyzed for statistically significant differences using one-way ANOVA followed by Dunnett post hoc test); (C) estradiol level of rats in each group (Data were analyzed for statistically significant differences using one-way ANOVA); (D) follicle stimulating hormone level of rats in each group (Data were analyzed for statistically significant differences using one-way ANOVA); (E) progesterone level of rats in each group (Date were non-normal distribution, Kruskal–Wallis rank-sum test was used). Compared to the blank group, #P < 0.05, ##P <0.01, compared with letrozole group,* P <0.05,*** P <0.001.
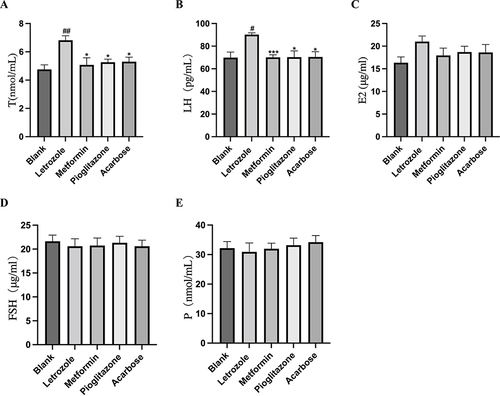
Figure 7 Comparison of kiss-1 positive neurons in hypothalamic arcuate nucleus of rats in each group. (A) Number of Kiss1-positive neurons in the ARC. n=8 values were presented as the mean±SEM (Data were analyzed for statistically significant differences using one-way ANOVA followed by Tukey post hoc test). Compared to the blank group, ###P< 0.001, compared with letrozole model group,***P<0.001. (B-E) Representative photographs of Kiss1-positive neurons in ARC (The brownish-yellow granules were positive for Kiss1, expressed in the cell membrane and cytoplasm); (B) Blank group (400x), (C) Letrozole group (400x), (D) Metformin group (400x), (E) Pioglitazone group (400x), (F) Acarbose group (400x).
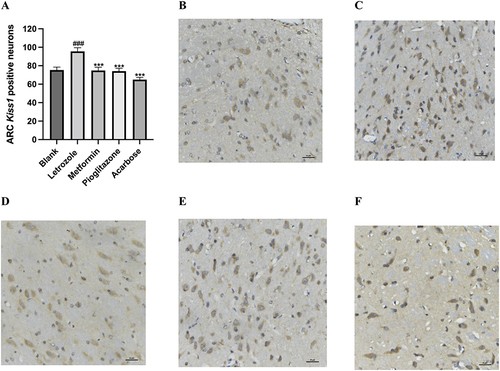
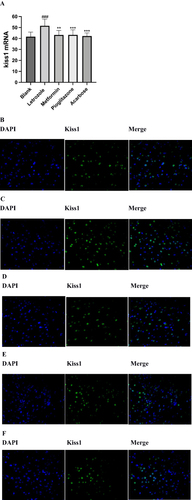
Figure 8 Comparison of kiss-1 mRNA-expressing in hypothalamic arcuate nucleus of rats in each group. (A) Comparison of Kiss1 mRNA-expressing in ARC, n=8 values were presented as the mean±SEM (Mean optical density analysis of sections was performed using ImageJ, and statistical analysis was performed using the Kruskal–Wallis rank sum test because the data were non-normally distributed). Compared with the blank group, ###P< 0.001, compared with letrozole model group,**P<0.01,***P<0.001. (B-E) Expression of cytosolic markers DAPI (blue fluorescence) and KiSS1 mRNA (green fluorescence) in the ARC; (B) Blank group (400x), (C) Letrozole group (400x), (D) Metformin group (400x), (E) Pioglitazone group (400x), (F) Acarbose group (400x).