
Figures & data
Table 1 Clinical Parameters of the Polycystic Ovarian Syndrome (PCOS) Patients Compared with the Control Groups
Table 2 The Characteristics of Prenatal Androgenized (PNA) Mice Compared with the Control Group
Figure 1 The complete workflow of the study.
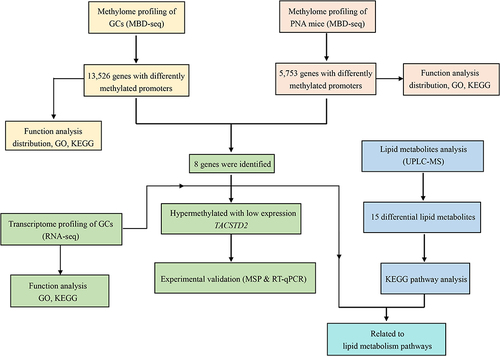
Figure 2 Gene annotation of the differentially methylated regions (DMRs) in GCs of PCOS patients vs control groups. (A) The distribution of hypermethylated DMRs; (B) The distribution of hypomethylated DMRs; (C) The distribution of overall DMRs.
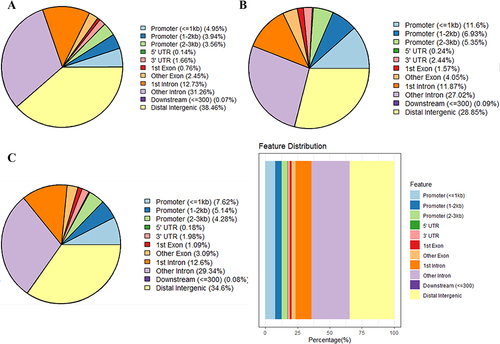
Figure 3 Distribution and bioinformatic analysis of differentially methylated regions (DMRs) on the genome of PCOS vs control groups (A) The distribution of hypermethylated regions (red) and hypomethylated regions (blue) DMRs in the whole genome; (B) The distribution of DMRs located in CpG and genomic regions; (C) GO analysis of genes with DMRs promoters (D) KEGG analysis of genes with DMRs promoters.
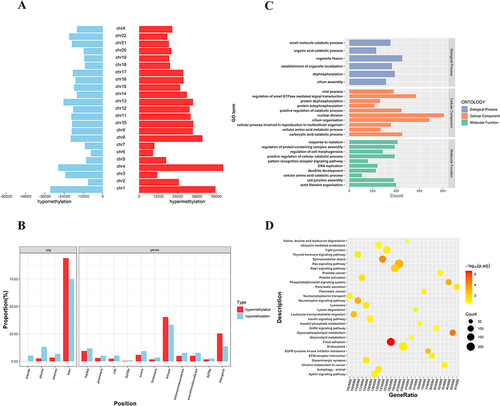
Figure 4 Serological and morphological identification of prenatal androgenized (PNA) mice. (A) The proportion of estrus duration, serum testosterone concentration, and number of secondary follicles in PNA mice and control groups (*P<0.05, **P<0.01, ****P<0.0001; multiply the proportion of estrus duration data by 100 to ensure the vertical height); (B) Control group mouse ovary HE staining section; (C) PNA mouse ovary HE staining section; the black arrows indicate the primordial follicles.
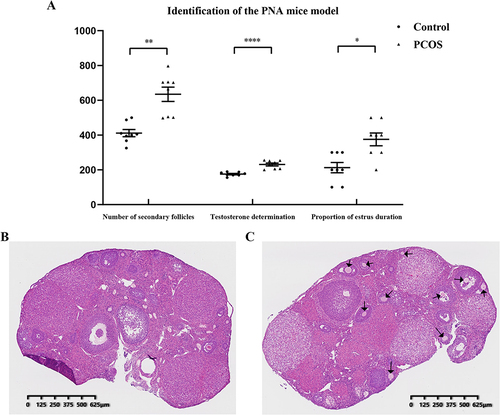
Figure 5 Gene annotation of the differentially methylated regions (DMRs) in PNA mice vs control mice. (A) The distribution of hypermethylated DMRs; (B) The distribution of hypomethylated DMRs; (C) The distribution of overall DMRs.
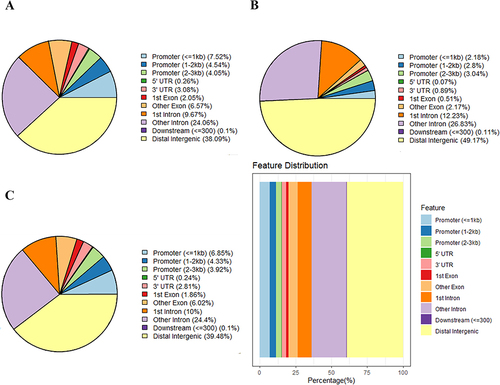
Figure 6 Distribution and bioinformatic analysis of differentially methylated regions (DMRs) on the genome of PCOS vs control groups. (A) The distribution of hypermethylated regions (red) and hypomethylated regions (blue) DMRs in the whole genome; (B) The distribution of DMRs located in the CpG and genomic regions; (C) GO analysis of genes with DMRs promoters; (D) KEGG analysis of genes with DMRs promoters.
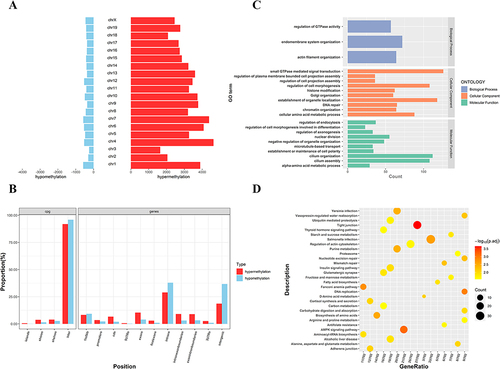
Figure 7 Identification of differentially expressed genes (DEGs) in GCs of PCOS patients vs control groups. (A) The hierarchical cluster heatmaps of DEGs; (B) The Venn diagrams of up-regulated and down-regulated DEGs, respectively; (C) GO function analysis of DEGs; (D) KEGG function analysis of DEGs.
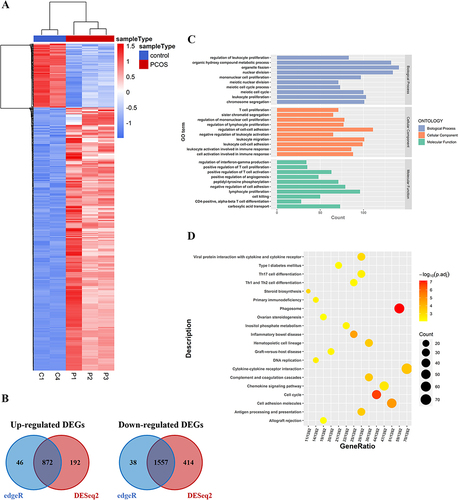
Table 3 The Genes Were Identified by the Intersection of PNA Mice and PCOS Patients
Figure 8 Validation of the promoter methylation and gene expression levels of TACSTD2. (A) MSP 2% agarose gel electrophoresis results; (B) RT-qPCR of TACSTD2 in PCOS patients GCs vs control groups GCs (**P<0.01).
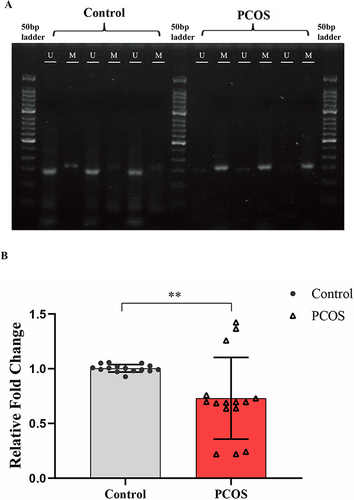
Figure 9 Analysis of serum differential lipids and metabolic pathways in PCOS patients vs control groups. (A) The heatmap of the hierarchical cluster of serum differential lipids; (B) Scatter plots of serum differential lipid KEGG metabolic pathway.
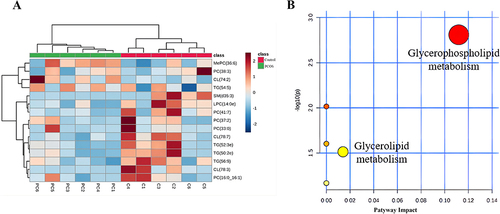
Table 4 Serum Differential Lipids in PCOS Patients Compared with Control Groups