
Figures & data
Figure 1 Empagliflozin ameliorated HFD-induced obesity and blood glucose. (A) Folding line graph of body weight change over time for each group of mice (n=9). The black arrow indicates the point in time when empagliflozin intervened. The ** on the first straight line indicates HFD vs NCD, P<0.01. **HFD vs NCD, p<0.01. &&HFD vs Empa, p<0.01. (B) Comparison of insulin levels in three groups of mice (n=8). (C) Comparison of fasting blood glucose levels in the three groups of mice (n=8). (D) IPTGG results. **HFD vs NCD, p<0.01. andand, HFD vs Empa, p<0.01. ns, P>0.05.
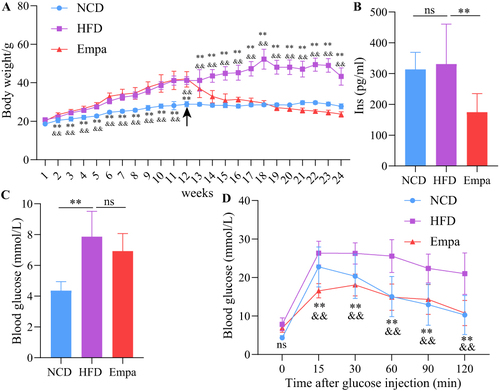
Figure 2 Empagliflozin alleviated lipid profile, liver damage, inflammation and oxidative stress. (A) TC. (B) TG. (C) LDL-C. (D) HDL-C. (E) ALT. (F) AST. (G) Liver weight of mice. N=8/group. (H) MDA. (I) SOD. (J) TNF-α. (K) IL-6. (L) IL-1β. N=4/group. ns, P>0.05. **P<0.01.
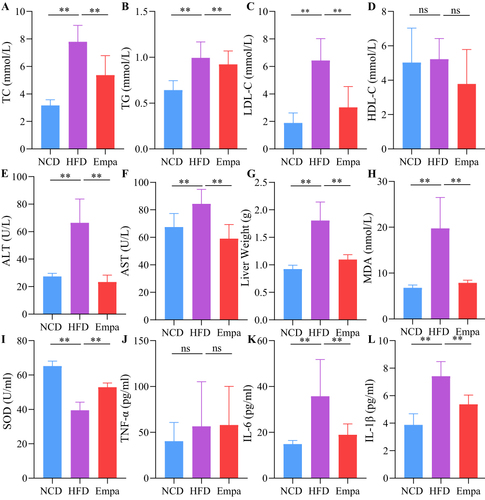
Figure 3 Effects of empagliflozin on liver histology injuries. (A) HE staining. (B) Masson staining. (C) Oil red staining. (D) TEM images showed the mitochondria, mitochondrial microautophagy structure and ribosomes.
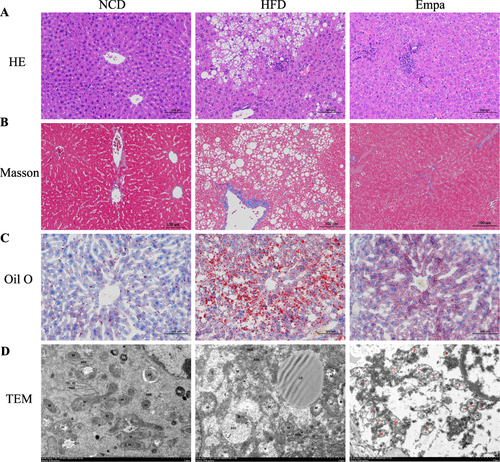
Figure 4 Effects of empagliflozin on liver metabonomics. (A) PCA score plot. (B) OPLS-DA score plot (HFD/NCD group). (C) OPLS-DA score plot (Empa/HFD group). (D) Volcano plot (HFD/NCD group). (E) Volcano plot (Empa/HFD group). (F) Top 20 KEGG enrichment pathway bubble maps.
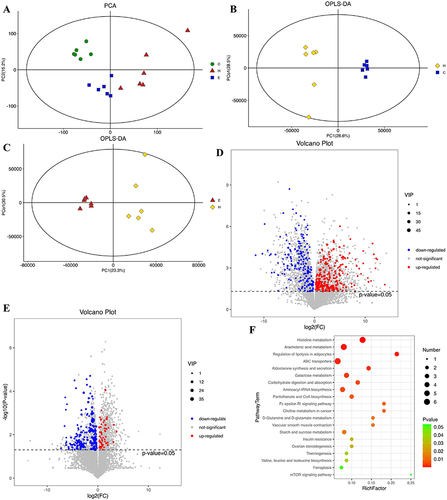
Table 1 Overlapping Differential Metabolites in the HFD/NCD and Empa/HFD Groups