Figures & data
Figure 1 Workflow of the study.
Abbreviations: T2DM, type 2 diabetes mellitus; LASSO, least absolute shrinkage and selection operator; ROC, receiver operating characteristic; DCA, decision curve analysis.
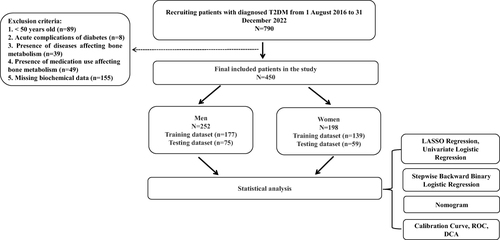
Table 1 Baseline Characteristics of the Study Population
Table 2 Univariate and Multivariate Analysis of Factors Associated with a BMD Decrease in Total Study Population
Figure 2 Comparison of ROC curves among different machine learning models.
Notes: (A) Comparison of ROC curves among different machine learning models for the prediction of BMD decreases in male patients. (B) Comparison of ROC curves among different machine learning models for the prediction of BMD decreases in female patients.
Abbreviations: ROC, receiver operating characteristic; BMD, bone mineral density; AUC, area under the curve; LR, logistic regression; RF, random forest; XGBoost, extreme gradient boost; SVM, support vector machine; DT, decision tree; KNN, k-nearest neighbors.
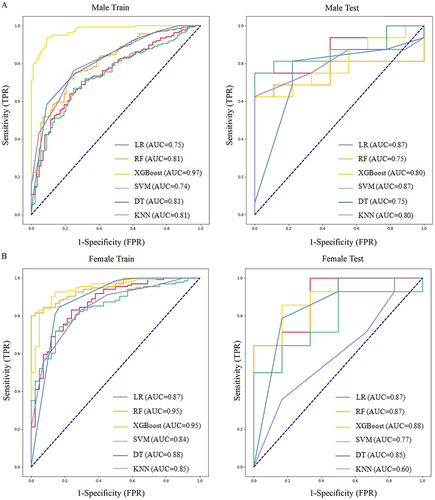
Figure 3 Nomograms to predict the incidence of BMD decreases.
Notes: (A) The nomogram was constructed for male T2DM patients, with drinking, ALP, UA, and ASMI incorporated. (B) The nomogram was constructed for female T2DM patients, with age, PINP, ICW, and PBF incorporated. In the drinking section of the figure, 0 represents non-drinking, and 1 represents drinking.
Abbreviations: BMD, bone mineral density; T2DM, type 2 diabetes mellitus; ALP, alkaline phosphatase; UA, uric acid; ASMI, appendicular skeletal muscle mass index; PINP, N-terminal propeptide of type I procollagen; ICW, intracellular water; PBF, percentage of body fat.
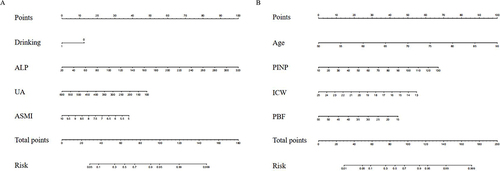
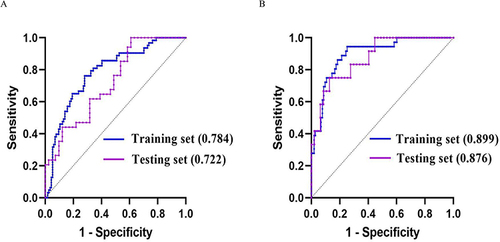
Figure 4 The ROC curves of the nomograms.
Notes: (A) In male patients, the AUCs of the nomogram are 0.784 (95% CI: 0.715–0.854) in the training dataset and 0.722 (95% CI: 0.608–0.835) in the testing dataset, respectively. (B) In female patients, the AUCs of the nomogram are 0.899 (95% CI: 0.842–0.955) in the training dataset and 0.876 (95% CI: 0.774–0.978) in the testing dataset, respectively.
Abbreviations: ROC, receiver operating characteristic; AUC, area under the curve; CI, confidence interval.