
Figures & data
Table 1 Clinic Baseline Characteristics by Gender of 943 Patients with Type 2 Diabetes
Figure 1 The proportion of antidiabetic medications used by females and males, showing that the use of metformin and sulphonylurea was significantly higher in the male group (76.8% vs 82.1%; p=0.044 and 50.8% vs 59.3%; p=0.009, respectively); On the other hand, the use of pioglitazone was significantly higher in the female group (21.2% vs 15.6%; p=0.027). * p<0.05, ** p<0.01.
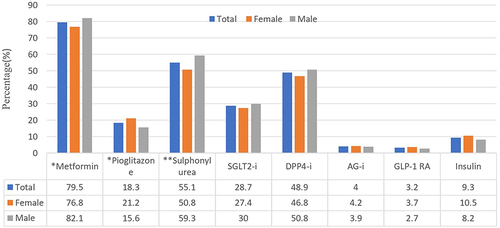
Table 2 Anthropometric and Biochemical Data of 943 Patients with Type 2 Diabetes Were Analyzed Before and After the Lockdown
Figure 2 The mean HbA1c was significantly improved in both females and males after the lockdown compared to the period before the lockdown (7.0±1.0 vs 6.8±1.0, p=0.004; 7.0±1.0 vs 6.8±0.9, p<0.001, respectively). Similarly, the proportion of individuals achieving HbA1c target ≤7% was significantly higher after the lockdown compared to the period before the lockdown for both females and males (62.1% vs 70.5%, p=0.008; 60.9% vs 67.5%, p=0.032, respectively). * p<0.05, ** p<0.01, *** p<0.001.
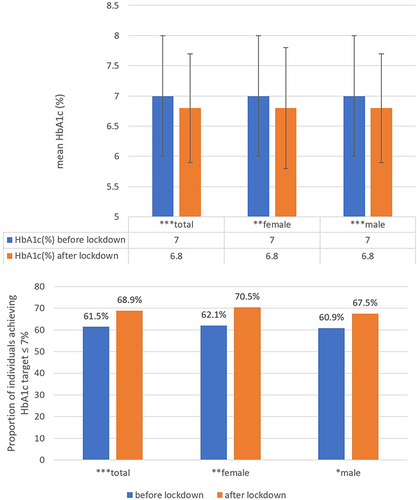
Table 3 Stepwise Multiple Regression Analysis of Changes (Before-After) in HbA1c Levels. After Adjusting for Age and Gender, the HbA1c Levels Before the Lockdown Were a Positive Contributor to Changes in HbA1c Levels. Conversely, BMI and Co-Morbidity with Dyslipidemia Were Negative Contributors to Changes in HbA1c Levels