
Figures & data
Figure 1 Effects of miR-221-3p on wound healing in diabetic mice. Representative photomicrographs (a) and summary data (b) showing changes in the area of excisional wounds on days 0, 2, 4 and 8 in diabetes mice injected with either miRNA mimic negative control (Ctrl) or miR-221-3p agomir (miR-221-3p) (n = 4). Data are presented as mean ± SEM, n = 4. *P < 0.05, **P < 0.01 for Ctrl vs DM-Ctrl. #P < 0.01 for DM-Ctrl vs DM-miR-221-3p.
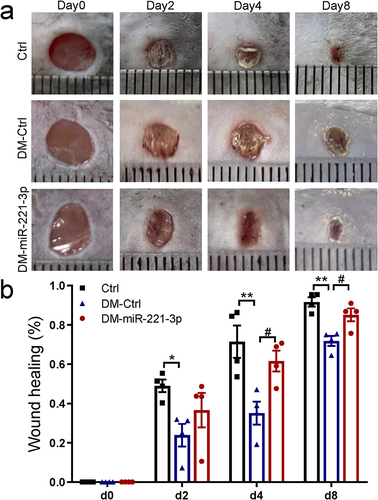
Figure 2 Effects of miR-221-3p on apoptosis and angiogenesis in diabetic mice. The TUNEL assay was performed to examine the role of diabetes and miR-221-3p overexpression on the apoptosis of epithelial layer at the edge of the wound (a and c). TUNEL-positive cells are shown in green and the nuclei are labeled with DAPI (blue). Scale bar is 50 µm. Angiogenesis analysis by immunohistochemistry staining of CD31 in dorsal skin sections from normal mice and diabetes mice injected with either Ctrl or miR-221-3p, quantified by the number of blood vessels per unit area (b and d). Scale bars, 50 μm. Data are presented as mean ± SEM, n = 3–5. *P < 0.05, **P < 0.01 for Ctrl vs DM-Ctrl. #P < 0.01 for DM-Ctrl vs DM-miR-221-3p.
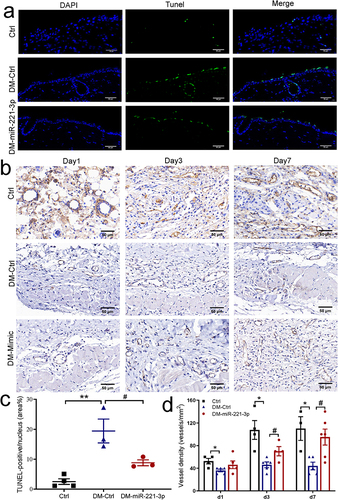
Figure 3 Effects of high glucose on THBS1. (a) Representative image and summary data showing relative THBS1 mRNA and protein expression levels in HaCaT cells treated with normal glucose (NG, 5.5 mM) or high glucose (HG, 35 mM or 50mM) (n = 3), and summary data of protein concentrations of THBS1 secreted into the medium from HaCaT cells cultured in NG or HG medium (n = 4). (b) Examination of total and early apoptosis cells in HaCAT treated with normal medium (NG-Ctrl), NG and added with exogenous THBS1 protein (NG+THBS1) or high glucose medium (HG-Ctrl). Representative image and summary data of the apoptosis cells was assessed by flow cytometry (n = 6). (c) Representative image and summary data of the tube formation assay on HUVECs co-cultured with the conditioned supernatant of HaCaT. Scale bar is 100 µm. Data are described with mean ± SEM, n = 3. *P < 0.05, **P < 0.01 and ***P < 0.001 compared with Ctrl.
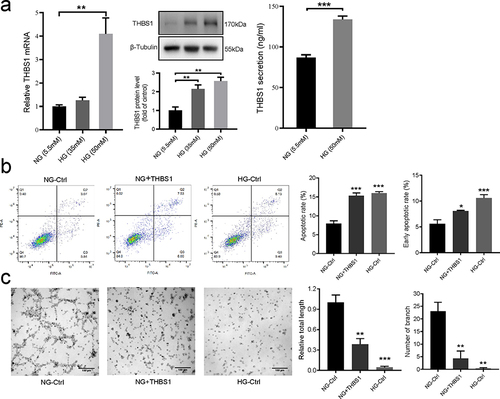
Figure 4 Effect of miR-221-3p on THBS1 and cell function under the intervention of high glucose. (a) Sequence alignment of the wild-type (WT) 3′-untranslated region (3′-UTR) of THBS1 containing putative miR-221-3p-binding sites and the miR-221-3p sequence. Mutated (mut) 3ʹ-UTR of THBS1 without the putative miR-221-3p-binding site. (b) Relative activities of luciferase of plasmids carrying WT / mutant THBS1 3ʹ-UTR among HEK293T cells co-transfected with Ctrl / miR-221-3p mimic (n = 3) were determined using the Luciferase Dual Reporter gene assay detection system. (c) Representative image and summary data showing relative mRNA and showing protein expression levels of THBS1 transfected with Ctrl or miR-221-3p mimic (n = 4–6). ACTB was used as the mRNA internal reference. Protein band intensities were normalized to β-tubulin. (d) Representative image and summary data showing THBS1’s mRNA and protein expression levels among HaCaT cells transfected with negative control (siNC) / siTHBS1 were measured by rt-qPCR, Western blot, and ELISA (n = 4–6). (e) Examination of total and early apoptosis cells in HaCaT treated with high glucose medium transfected with negative control (HG-Ctrl), miRNA-221-3p mimic (Mimic) or small interfering RNA of THBS1 (siTHBS1). Representative image and summary data of the apoptosis cells was assessed by flow cytometry (n = 6). (f) Representative image and summary data of the tube formation assay on HUVECs co-cultured with the conditioned supernatant of HaCaT. Scale bar is 100 µm. Data are presented as mean ± SEM, n = 3. *P < 0.05, **P < 0.01 and ***P < 0.001 compared with Ctrl.
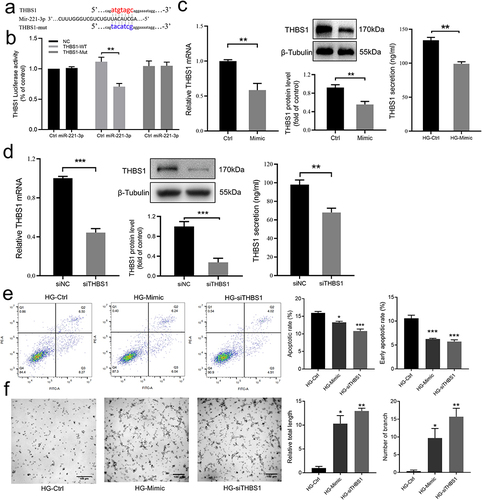
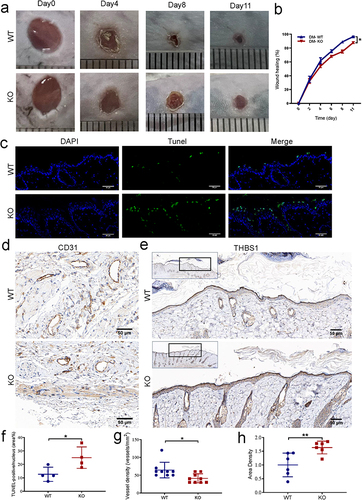
Figure 5 Effect of miR-221 knockout on wound healing in diabetes mice. Representative photomicrographs (a) and summary data (b) showing wound area changes on days 0, 4, 8, and 11 in wild type (WT) and Mir-221 knockout (KO) diabetes mice (DM). Data are described as mean ± SEM, n = 8. The TUNEL assay was conducted to examine the role of Mir-221 knockout on the apoptosis of epithelial layer at the edge of the wound (c and f). TUNEL-positive cells are shown in green while the nuclei are shown with DAPI (blue). Scale bar is 50 µm. Angiogenesis analysis based on immunohistochemistry (IHC) staining of CD31 in dorsal skin sections from DM-WT & DM-KO mice, quantified by the number of blood vessels per unit area (d and g). Scale bars, 50 μm. IHC staining of THBS1 in dorsal skin sections from DM-WT & DM-KO mice (e and h). Scale bars, 50 μm. Data are presented as mean ± SEM, n = 3–4. *P < 0.05 and **P < 0.01 for DM-WT vs DM-KO.
Data Sharing Statement
Upon reasonable request to the corresponding author, the data involved in this study will be provided.