Figures & data
Table 1 Incidence of MS Stratified by Sex in the Follow-Up Population with Baseline Normal FPG Range
Figure 1 The Incidence of MS by quartiles of FPG.
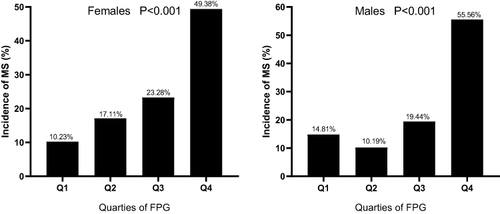
Table 2 Incidence of MS with Baseline Normal FPG Range in Subjects of Different Age Groups
Table 3 Multivariate Logistic Regression of FPG for MS
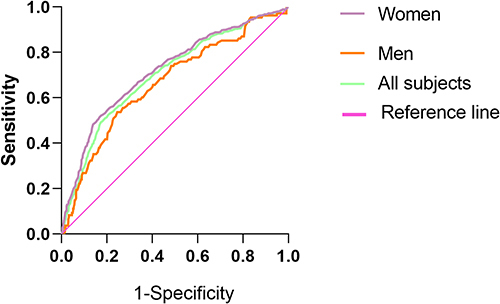
Table 4 ROC Analysis of MS in the Follow-Up Population with Baseline Normal FPG Range
Figure 2 ROC curves for FPG to predict MS in subjects with baseline normal FPG range.