
Figures & data
Table 1 Comparisons of Clinical Characteristics of T2DM Patients with Different eGFR (mL/min/1.73 m2) Levels
Figure 1 Flowchart of the patient selection process.
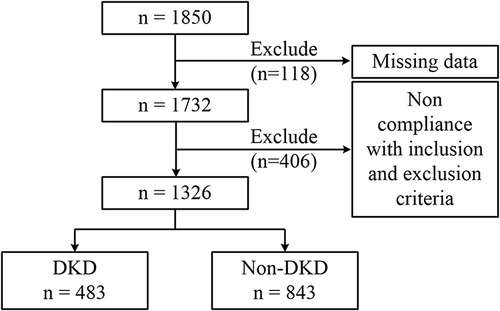
Figure 2 Comparisons of UA, UA/CR and UHR levels among different eGFR groups. Bars are shown as means ± SDs. * and ** denote significance at P value of <0.001 and <0.05, respectively.
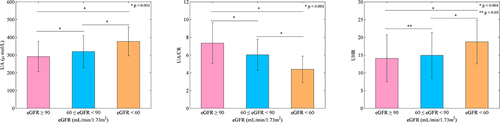
Table 2 Spearman Correlation of UA, UA/CR and UHR with Clinical Variables
Table 3 Logistic Regression Analysis of UA, UA/CR and UHR for DKD
Table 4 Logistic Regression Analysis of UA, UA/CR and UHR for Kidney Impairment in Patients with T2DM
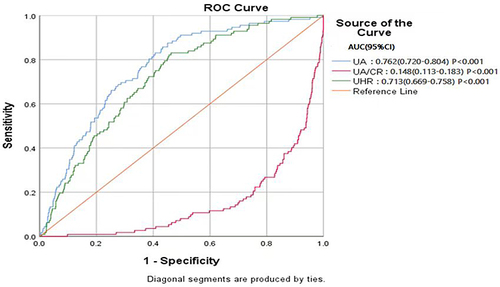
Figure 3 ROC for UA, UA/CR and UHR as predictors of impaired renal function (eGFR <60 mL/min/1.73 m2).
Data Sharing Statement
All data are included in the manuscript.