Figures & data
Figure 1 Beneficial effects of liraglutide and semaglutide on body weight, muscle strength, and muscle mass in HFD mice. (A) Changes in body size between HFD fed and normal diet fed mice. (B) Dynamic changes in body weight. (C) Changes in body weight after treatment with liraglutide and semaglutide. (D) Changes in relative grip strength. (E) Changes in longest hanging time. (F) Changes in body fat percentage. (G) Changes in visceral fat. (H) Changes in lean body mass percentage. (I) Changes in relative lower limb muscles mass. *P < 0.05 compared with the control group, #P < 0.05 compared with the HFD group.
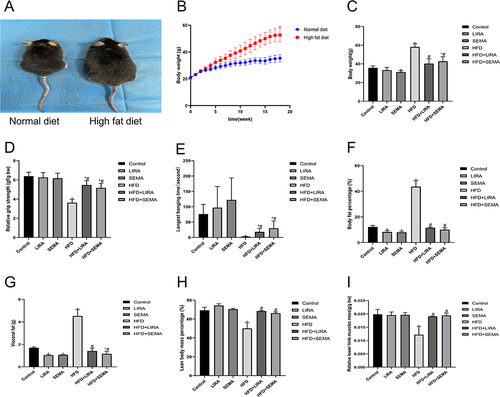
Figure 2 Liraglutide and semaglutide significantly improved glucose tolerance, insulin resistance, dyslipidemia, and muscle atrophy in HFD mice. (A) IPGTT was performed for each group. (B) ITT was performed for each group. (C) The levels of HOMA-IR in each group. (D) The levels of TG in each group. (E) The levels of TC in each group. (F) Representative images of GAS muscle H&E staining (scale bar = 50 μm). (G) The mean muscle CSA in each group. (H) Representative images of GAS muscle Oil Red O staining (scale bar = 50 μm). (I) Oil red staining area of each group. *P < 0.05 compared with the control group, #P < 0.05 compared with the HFD group.
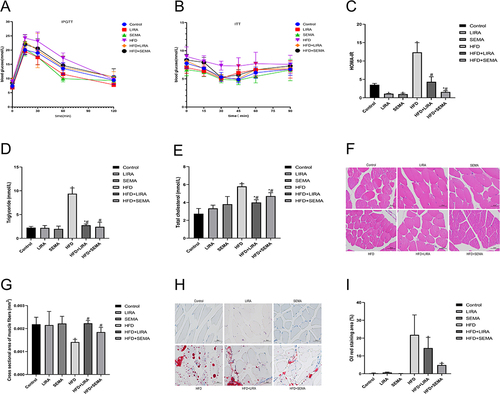
Figure 3 Liraglutide and semaglutide improved muscle atrophy and insulin resistance in HFD mice through the SIRT1 pathway. (A) The mRNA level of muscle atrophy marker Atrogin-1 was assessed by qRT-PCR. (B) The protein expression of Atrogin-1 was assessed by Western blotting. (C) The mRNA level of myogenic factor Myogenin was assessed by qRT-PCR. (D) The protein expression of Myogenin was assessed by Western blotting. (E) The mRNA level of GLUT4 was assessed by qRT-PCR. (F) The protein expression of GLUT4 was assessed by Western blotting. (G) The mRNA level of SIRT1 was assessed by qRT-PCR. (H) The protein expression of SIRT1 was assessed by Western blotting. *P < 0.05 compared with the control group, #P < 0.05 compared with the HFD group.
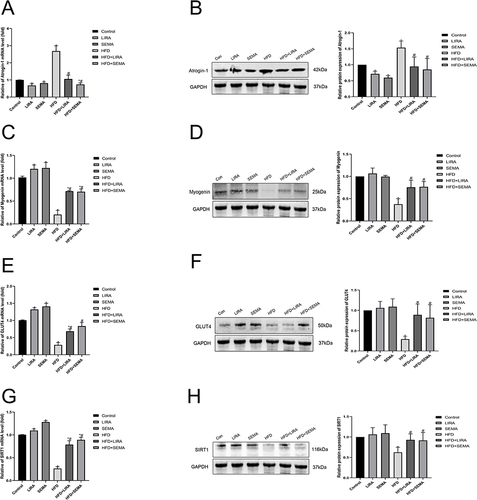
Figure 4 Liraglutide and semaglutide alleviated PA induced muscle atrophy, lipid accumulation, and insulin resistance in C2C12 myotubes. (A) The mRNA level of Atrogin-1 was measured by qRT-PCR. (B) The mRNA level of MuRF-1 was measured by qRT-PCR. (C) The mRNA level of MyoD was measured by qRT-PCR. (D) The mRNA level of Myogenin was measured by qRT-PCR. (E) Representative images of MYH2 immunofluorescence in C2C12 myotubes (scale bar = 50 μm). (F) The diameter of myotubes. (G) Representative images of lipid accumulation in C2C12 myotubes stained with oil red O (scale bar = 50 μm). (H) The Oil red staining area. (I) The mRNA level of GLUT4 was measured by qRT-PCR. (J) The fluorescence intensity of 2-NBDG glucose uptake. *P < 0.05 compared with the control group, #P < 0.05 compared with the PA group.
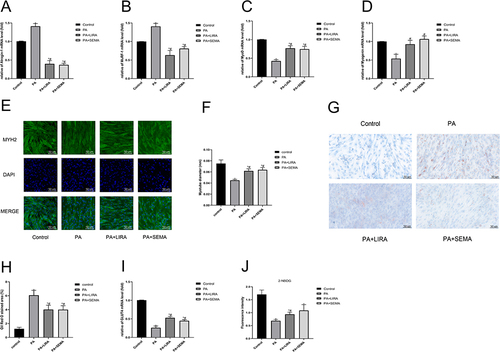
Figure 5 Liraglutide and semaglutide mitigated PA induced muscle atrophy and insulin resistance via the SIRT1 pathway. (A) The mRNA level of SIRT1 was measured by qRT-PCR. (B) The effect of 100 µM EX-527 on inhibiting SIRT-1 protein expression was determined by Western blotting. (C) The protein expression of Atrogin-1 was assessed by Western blotting. (D) The protein expression of Myogenin was assessed by Western blotting. (E)The protein expression of GLUT4 was assessed by Western blotting. (F) The protein expression of SIRT1 was assessed by Western blotting. *P < 0.05 compared with the control group, #P < 0.05 compared with the PA group, &P < 0.05 compared with the PA+LIRA or PA+SEMA group.
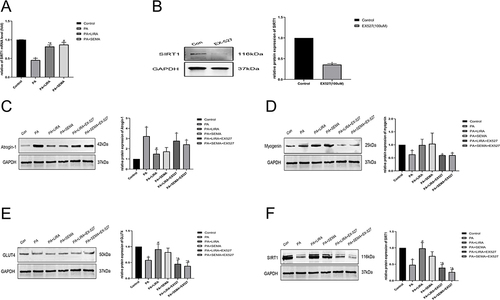
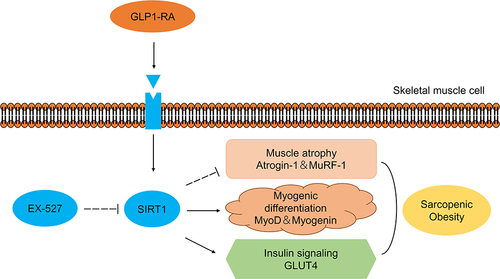
Figure 6 Schematic diagram of beneficial effects of liraglutide and semaglutide on obesity-induced skeletal muscle atrophy.