
Figures & data
Box 1 Metabolic Risk Abnormalities - 2 Out of 7
Table 1 Baseline Characteristics of the Participants
Figure 1 The percentage of liver fibrosis risk divided by the FIB-4 score in the normal, non-obstructive, and CAD groups. The percentage of high FIB-4 score were significantly higher in the CAD group than in the other two groups (p<0.01).
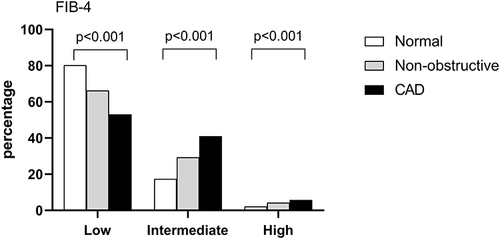
Figure 2 The percentage of liver fibrosis risk divided by the NFS in the normal, non-obstructive, and CAD groups. The percentage of high NFS were significantly higher in the CAD group than in the other two groups (p<0.01).
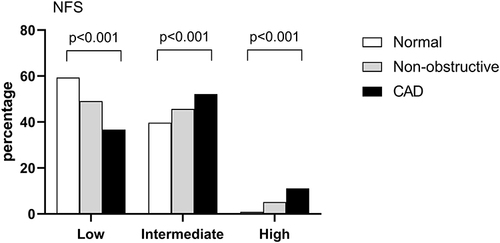
Table 2 Factors Associated with CAD in Subjects with MAFLD: Logistic Regression
Table 3 Associations of Noninvasive Fibrosis Scores with CAD in Subjects with MAFLD: Logistic Regression
Table 4 Correlation of Liver Fibrosis Scores with Clinical Parameters: Correlation Analysis