
Figures & data
Table 1 Baseline and Treatment Characteristics of the Study Participants (n = 86)
Table 2 Genotype and Allele Frequency Distribution of rs72552763 SNP Across the Study Participants (n = 86)
Table 3 Logistic Regression Analysis for Predictor of Metformin Response Among the Study Participants (n = 85)
Figure 1 Independent Samples Mann–Whitney U-test between genotypes of Met420del variant of SLC22A1gene (rs72552763) and absolute reductions in HbA1C (A) and in FBG (B) following three months of metformin treatment.
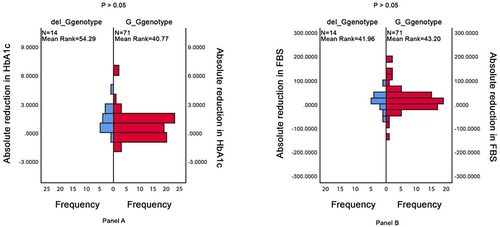
Figure 2 Independent Samples Mann–Whitney U-test between genotypes of Met420del variant of SLC22A1gene (rs72552763) and median HbA1c (A) and FBG (B) levels following three months of metformin treatment.
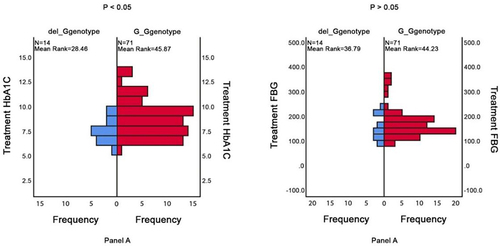
Table 4 Logistic Regression Analysis for Predictor of Glycemic Control Among the Study Participants (n = 85)