
Figures & data
Table 1 Baseline Characteristics of the Study Population Based on Sex and Presence of Metabolic Syndrome (MetS)
Table 2 Correlation Between Serum Uric Acid to Creatinine Ratio (SUA/Cr) and Clinical Parameters in Overweight and Obese Population
Table 3 Univariate Logistic Regression Analysis for Clinical Variables Associated with Risk of Metabolic Syndrome (MetS)
Table 4 Multivariate Logistic Regression Analysis for Serum Uric Acid to Creatinine Ratio (SUA/Cr) Associated with Risk of Metabolic Syndrome (MetS)
Table 5 Multivariate Logistic Regression Analysis for Serum Uric Acid to Creatinine Ratio (SUA/Cr) Associated with Risk of Metabolic Syndrome (MetS) Components
Figure 1 Associations between serum uric acid to creatinine ratio (SUA/Cr) and the number of metabolic syndrome (MetS) components. Values are adjusted for age and gender.
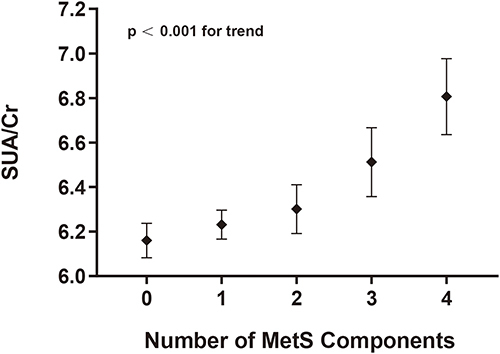
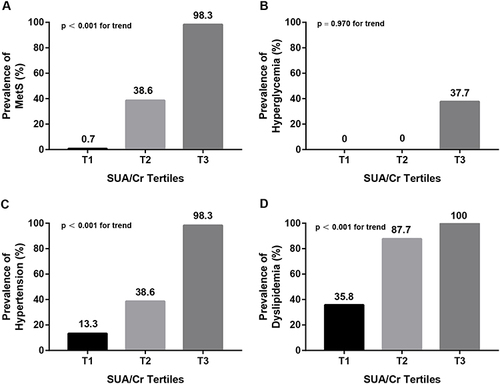
Figure 2 Comparison of the prevalence of MetS and its components between SUA/Cr tertiles. (A) Comparison of the prevalence of MetS between SUA/Cr tertiles after controlling for age and sex. (B) Comparison of the prevalence of hyperglycemia between SUA/Cr tertiles after controlling for age and sex. (C) Comparison of the prevalence of HBP between SUA/Cr tertiles after controlling for age and sex. (D) Comparison of the prevalence of dyslipidemia between SUA/Cr tertiles after controlling for age and sex.
Data Sharing Statement
The raw data supporting the conclusions of this article will be made available by the authors, without undue reservation.