Figures & data
Table 1 Comparison of Indicators Between NDPN and DPN Groups
Figure 1 Comparison of FAR index between NDPN group and DPN group.
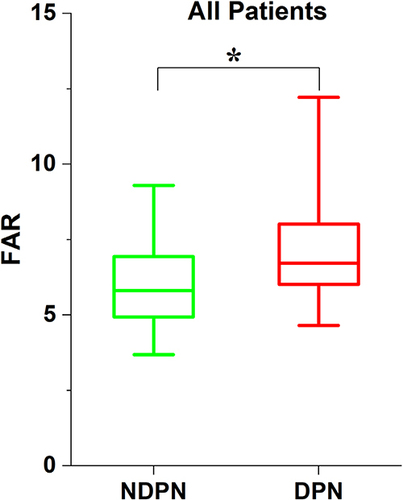
Figure 2 Comparisons of DPN morbidity in the men group and women group.
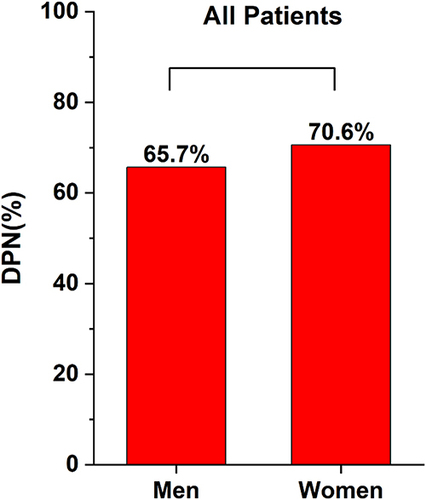
Table 2 Comparison of NCV Between NDPN and DPN Groups
Table 3 Comparison of Indicators Between the Low-FAR Group and High-FAR Group
Figure 3 Comparisons of DPN and DR morbidity in the Low-FAR group and High-FAR group.
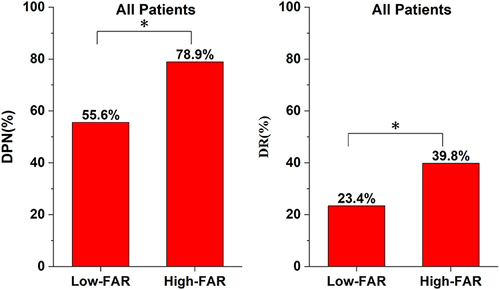
Table 4 Comparison of NCV Between Patients in the Low-FAR and High-FAR Groups
Table 5 Correlation Between FAR and Clinical Characteristics in T2DM
Figure 4 Correlation Between FAR and Clinical Characteristics in T2DM.
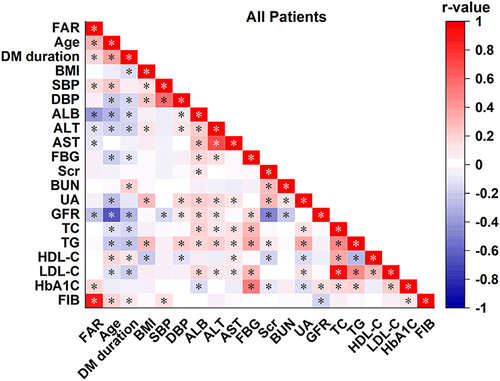
Table 6 Correlation Between FAR and Nerve Conduction Velocities in T2DM
Figure 5 Correlation Between FAR and NCV in T2DM.
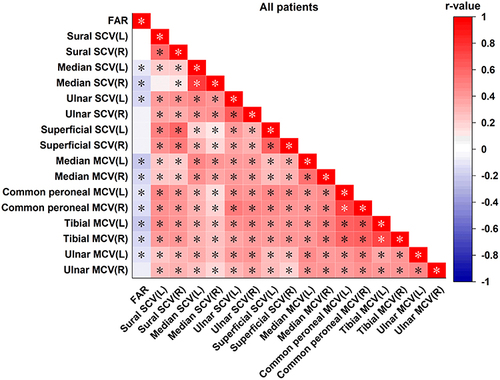
Table 7 Logistic Regression Analysis of T2DM Patients with DPN
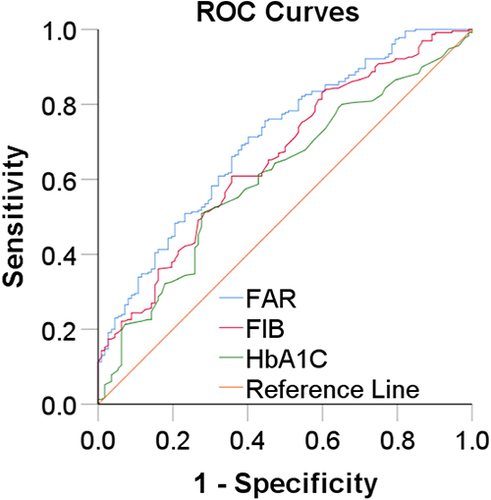
Table 8 The ROC Curve of FAR, FIB and HbA1c in Patients of T2DM with DPN
Figure 6 The ROC Curve of FAR, FIB and HbA1c in patients of T2DM with DPN.