Figures & data
Figure 1 Localized high-density calcium deposition was observed in the aortic arteries (A) and coronary arteries (B). The white arrow in (A) shows the calcification in the artery wall of aorta; the white arrow in (B) indicates the calcification in coronary artery wall.
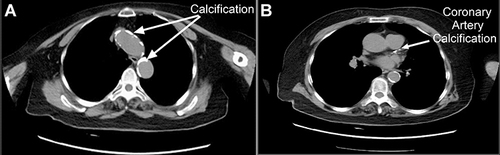
Figure 2 (a) The ECG showed sinus rhythm (HR:98 bpm), frequent atrial premature beats occurring in pairs, and some exhibiting a biphasic rhythm. (January 23, 2023 14:34:13); (b) the ECG showed sinus rhythm (HR 132 bpm), partial short-term ventricular tachycardia, and irregular intra-chamber conduction (January 30, 2023, 10:28:29); (c) the ECG showed rapid atrial fibrillation and ST segment depression (ST (I II III aVL aVF horizontal depression ≥ > 0.05 mV). (January 30, 2023 13:40:13); (d) a bedside chest X-ray revealed decreased lung transparency on the left and increased lung texture on January 30, 2023; “R”: right side of the patient; (e) the ECG showed rapid atrial fibrillation (HR: 177 bpm) with ST-T changes (ST-II III V4 V5 V6) horizontally inclined, upward and downward > 0.05 mV T (I) wave low and flat). (January 30, 2023 19:11:23); (f) the ECG showed sinus rhythm (HR: 87 bpm), frequent atrial premature beats occurring in pairs, and a T wave at a low level. (February 1, 2023, 16:17:58).
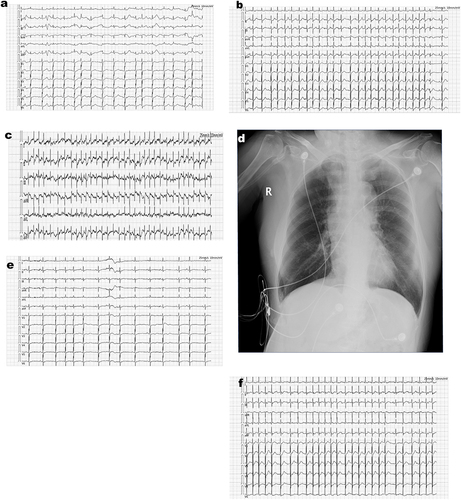
Table 1 Dynamic Evolutions in This Patient’s Laboratory Tests Following Hospitalization
Figure 3 Dynamic evolutions in this patient’s critical laboratory tests following hospitalization. Inflammatory indexes (white blood cell, WBC; procalcitonin, PCT) and acute cardiac infarction index (TnI) peaked on January 31, 2023. They rapidly declined to approximate baseline levels within four days, which were in accordance with the D-dimer change curve. Changes in serum amylase were significant 48 h after the patient experienced stomach pain and diarrhea five times in one night without fever (from January 30 to February 1, 2023).
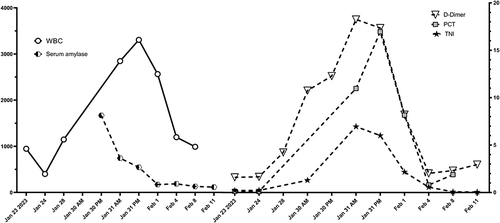
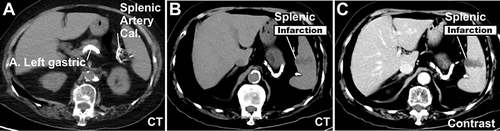
Figure 4 Several high-density calcifications in the splenic arteries (A–C), and a wedge-shaped region of low density within the spleen (B and C) were observed on an abdominal CT.