Figures & data
Table 1 Clinical Characteristics of the Study Participants
Table 2 Comparison of Parameter Differences Between Males and Females in Patients with BD Manifesting NAFLD
Table 3 Comparison of Parameters in Male Patients with BD
Table 4 Comparison of Parameters in Female Patients with BD
Table 5 Risk Factors for NAFLD in Male Patients with BD
Table 6 Risk Factors for NAFLD in Female Patients with BD
Figure 1 The predictive value of influencing factors on NAFLD in male patients with BD. (A) ROC curve of BMI in predicting NAFLD; (B) ROC curve of Glucose in predicting NAFLD; (C) ROC curve of ApoB in predicting NAFLD.
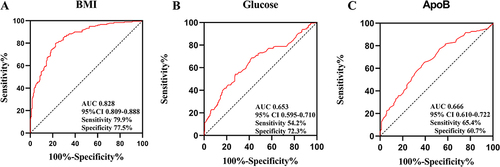
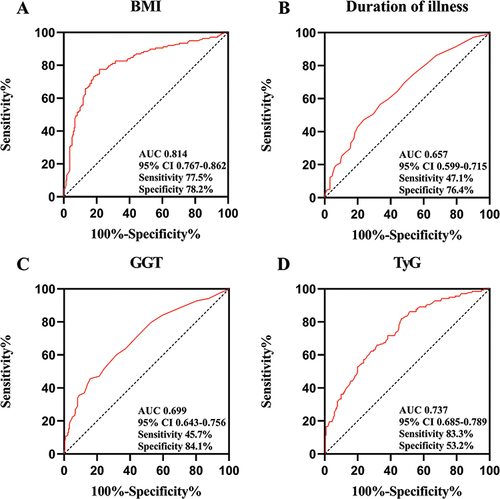
Figure 2 The predictive value of influencing factors on NAFLD in female patients with BD. (A) ROC curve of BMI in predicting NAFLD; (B) ROC curve of Duration of illness in predicting NAFLD; (C) ROC curve of GGT in predicting NAFLD; (D) ROC curve of TyG in predicting NAFLD.