Figures & data
Table 1 Effect of Oxymatrine on the Serum Parameters in High-Fat-High-Fructose-Diet Fed Rats
Figure 1 Comparison of body weight (a), liver weight (b), food intake (c), fasting blood glucose (d), fasting insulin (e), IGPTT (f), and AUC (g) of mice in each group. *p≤0.05 vs. NC, **p≤0.01 vs. NC, #p≤0.05 vs. HFDHFr, ##p≤0.01 vs. HFDHFr.
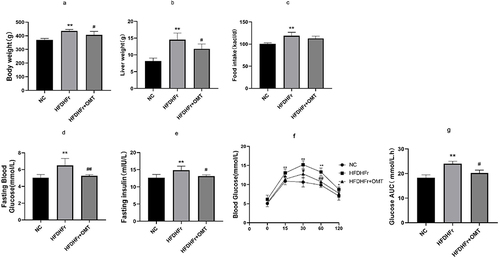
Figure 2 Comparison of liver TG content (a) in mice and HE staining and Oil Red O staining of mice liver tissue of each group (×200) (b). *p≤0.05 vs. NC, **p≤0.01 vs. NC, #p≤0.05 vs. HFDHFr, ##p≤0.01 vs. HFDHFr.
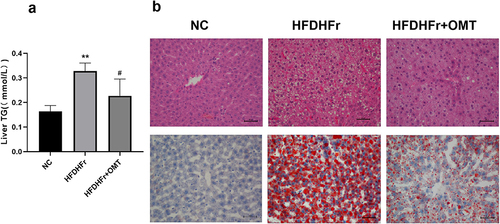
Figure 3 Among the serum (a) and liver (b) samples, the first 50 metabolites with the most significant differences among the three groups. Red represents high expression and blue represents low expression.
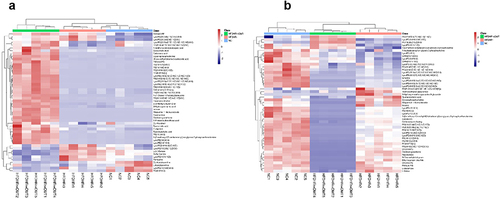
Figure 4 Other metabolites with significant differences among the three groups in liver samples. Red represents high expression and blue represents low expression.
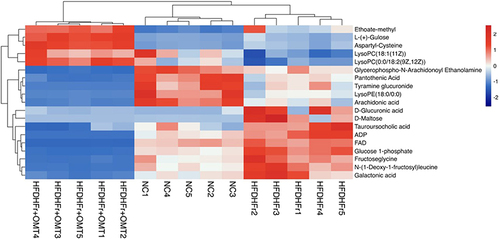
Figure 5 Metabolites with significant differences among the HFDHFr + OMT group and HFDHFr group in liver samples. Red represents high expression and blue represents low expression.
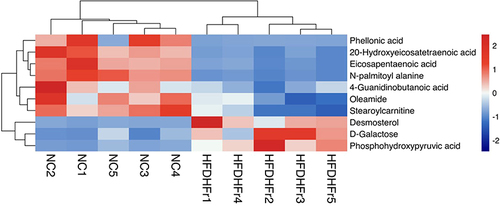
Figure 6 Metabolites with significant differences among the HFDHFr group and NC group in serum samples (a) and liver samples (b). Red represents high expression and blue represents low expression.
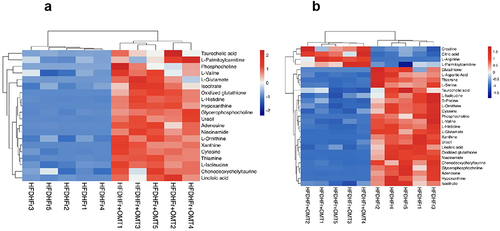
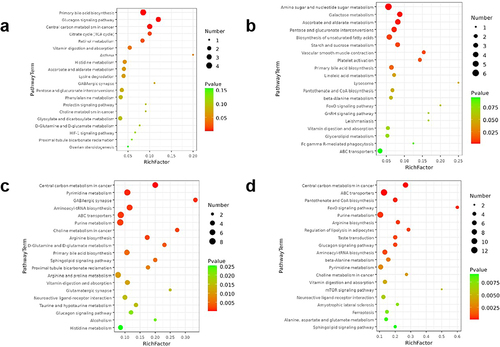
Figure 7 Metabolic pathways associated with disordered metabolites after long-term intake of high high-fat and high high-fructose in serum (a) and in liver (b) (TOP20). Metabolic pathways associated with disordered metabolites after OMT intervention in serum (c) and in liver (d) (TOP20).