Figures & data
Figure 1 Study subject flowchart.
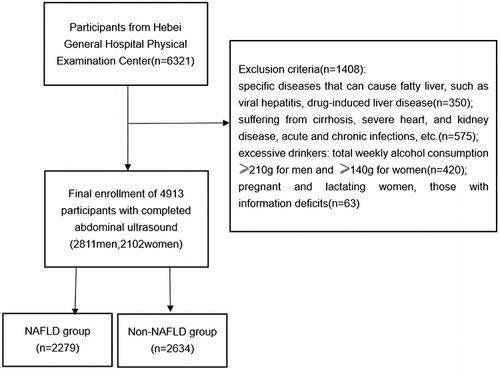
Table 1 Participant Characteristics Grouped According to NAFLD Status
Figure 2 Comparisons of WC and RC between individuals with and without NAFLD. (A) WC, (B) RC.
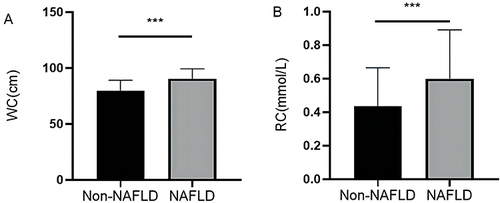
Table 2 Participant Characteristics Grouped According to RC Levels
Figure 3 Comparisons of WC and NAFLD prevalence among individuals with low and high RC levels. (A) WC, (B) NAFLD.
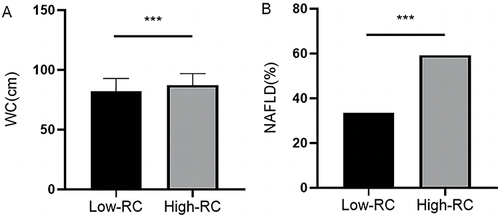
Table 3 Multifactorial Logistic Regression Analysis of the Relationship Between RC and NAFLD Risk
Table 4 Analyses of the Predictive Performance of RC, WC, and R-W for NAFLD in All Participant Subgroups
Figure 4 ROC curves for the RC-based prediction of NAFLD status in the overall study population and in individual subgroups. (A) Total population, (B) sex subgroup, (C) age subgroup.
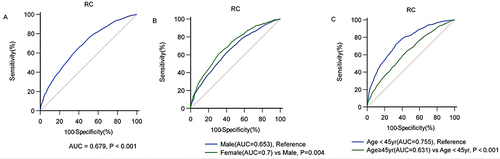
Table 5 Binary Logistic Regression Analysis for R-W Model Construction
Figure 5 ROC curves for the R-W-based prediction of NAFLD status in the overall study population and in individual subgroups. (A) Total population, (B) sex subgroup, (C) age subgroup.
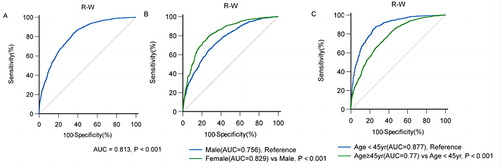
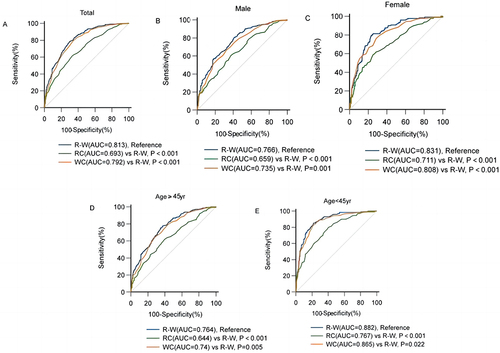
Figure 6 Comparisons of AUC values for the RC, WC, and R-W models when used to predict NALFD incidence in the overall study population and in each participant subgroup. (A) Total, (B) male, (C) female, (D) age ≥ 45 years, (E) age < 45 years.