Figures & data
Table 1 Comparison of Erythrocyte Parameters Between the PCOS Group and Control Group ()
Table 2 Comparison of General Information of Patients Between Groups [(), M (P25, P75)]
Table 3 Comparison of Metabolic Indexes Between Groups ()
Table 4 Correlation Between Hemoglobin and Metabolic Indicators in Patients with PCOS
Figure 1 Relationship between hemoglobin levels and related metabolic indicators ((A) BMI, (B) FPG, (C) 2-hPG, (D) FINS, (E) 2-hINS, (F) HOMA-IR, (G) QUICKI) in patients with PCOS.
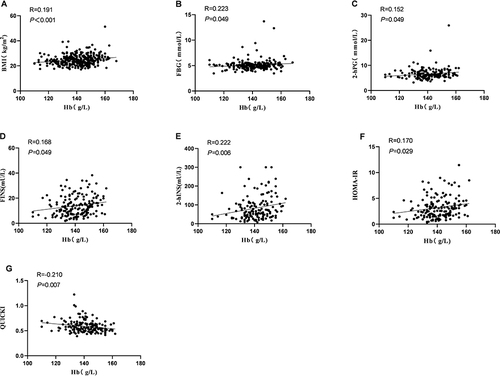
Table 5 Correlation Between Metabolic Disorders and High Hemoglobin in Patients with PCOS
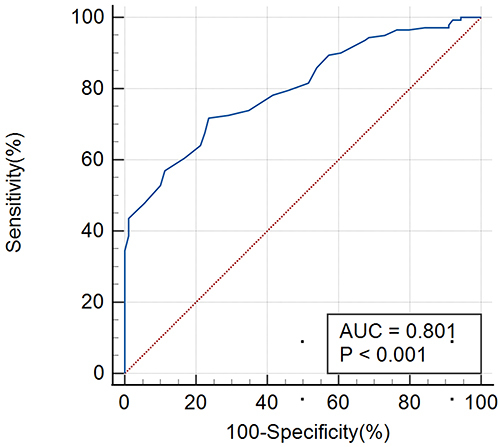
Figure 2 Prediction of IR in patients with PCOS based on hemoglobin levels based on the ROC curve.