Figures & data
Figure 1 The identification of exosomes. HK-2 cells were cultured under normal glucose (NG) and high glucose conditions (HG; 30mmol/L glucose) for 30h respectively. (A) Representative TEM image of exosomes derived from the culture supernatant of HG group and control group. (B) Exosomal markers CD9 and TSG101 were detected by Western blot. (C) The particle size of the exosomes (nm) enriched from the culture supernatant of two groups was examined through NTA using a ZetaView_Particle Metrix instrument. (D) The concentration of exosomes from the culture supernatant of two groups. *P<0.05 vs the control group.
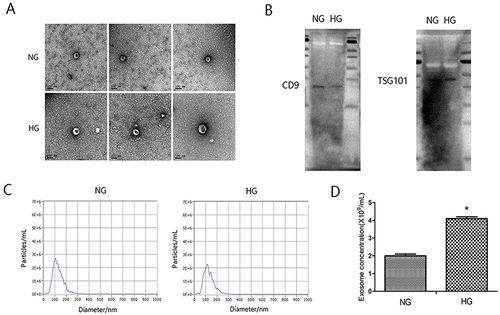
Table 1 The Top 20 Up-Regulated and Down-Regulated circRNAs Between HG Group and Control Group
Figure 2 CircRNA expression profiling in culture supernatant exosomes from HG group compared with controls. (A) Clustered heat map analysis of differentially expressed circRNAs. (B) The differentially expressed circRNAs between two groups. (C) Scatter plots of circRNAs signal values. (D) Volcano plots visualizing the differentially expressed circRNAs.
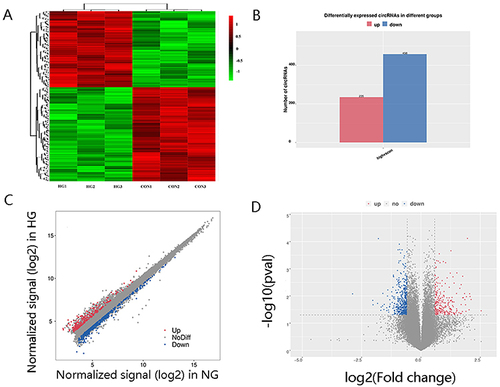
Figure 3 Chromosomal distribution of circRNAs in exosomes. (A) Chromosomal distribution of all circRNAs. (B) Chromosomal distribution of differentially expressed circRNAs.
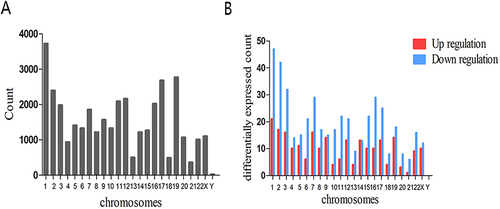
Figure 4 Validation of differentially expressed circRNA by qPCR. 10 candidate circRNAs were selected to validate their expression in the exosome from HK-2 cells culture medium of HG group and NG group. *P<0.05.
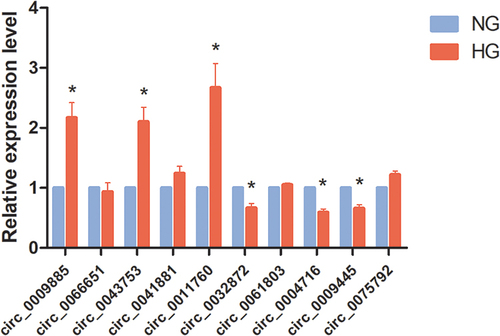
Figure 5 The siRNA interference effect and plasmid overexpression effect of circRNAs. (A) HK-2 cells treated with high glucose were transfected with negative control or circ_0009885 siRNA. And then circ_0009885 expression was measured by PCR. (B) HK-2 cells treated with high glucose were transfected with negative control or circ_0011760 siRNA. And then circ_0011760 expression was measured by PCR. (C) HK-2 cells treated with high glucose were transfected with negative control or circ_0043753 siRNA. And then circ_0043753 expression was measured by PCR. (D) HK-2 cells treated with high glucose were transfected with pCL5-0032872. And then circ_0032872 expression was measured by PCR. (E) HK-2 cells treated with high glucose were transfected with pCL5-0004716. And then circ_0004716 expression was measured by PCR. All results are presented as the mean ± SD of three independent experiments, each performed in triplicate. *P<0.05 vs the control group.
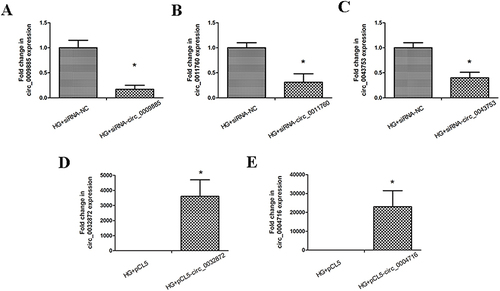
Figure 6 The effects of upregulated circRNAs on regulation of inflammatory factor and EMT related molecule. (A) HK-2 cells were cultured under normal glucose (NG) and high glucose conditions (HG; 30mmol/L glucose) for 48h respectively. And then CCL2, IL6, fibronetin, n cadherin, e cadherin and epcam expression was measured by PCR. (B) HK-2 cells were transfected with negative control or circ_0009885 siRNA. And then CCL2, IL6, fibronetin, n cadherin, e cadherin and epcam expression was measured by PCR. (C) HK-2 cells were transfected with negative control or circ_0011760 siRNA. And then CCL2, IL6, fibronetin, n cadherin, e cadherin and epcam expression was measured by PCR. (D) HK-2 cells were transfected with negative control or circ_0043753 siRNA. And then CCL2, IL6, fibronetin, n cadherin, e cadherin and epcam expression was measured by PCR. *P<0.05 vs the control group.
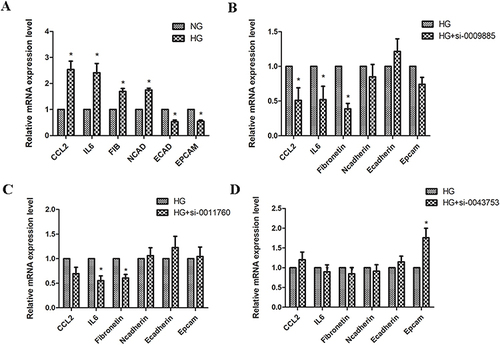
Figure 7 The effects of downregulated circRNAs on regulation of inflammatory factor and EMT related molecule. (A) HK-2 cells were cultured under normal glucose (NG) and high glucose conditions (HG; 30mmol/L glucose) for 48h respectively. And then CCL2, IL6, fibronetin, n cadherin, e cadherin and epcam expression was measured by PCR. (B) HK-2 cells were transfected with pCL5-0032872. And then CCL2, IL6, fibronetin, n cadherin, e cadherin and epcam expression was measured by PCR. (C) HK-2 cells were transfected with pCL5-0004716. And then CCL2, IL6, fibronetin, n cadherin, e cadherin and epcam expression was measured by PCR. *P<0.05 vs the control group.
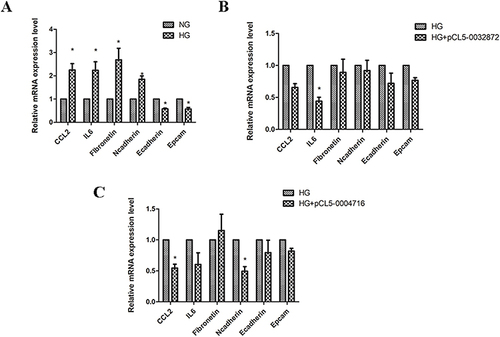
Figure 8 The effects of circRNAs on cell migration in HK-2 cells. (A) HK-2 cells were cultured under normal glucose (NG) and then cell migration assays were performed with transwell chambers. (B) HK-2 cells were cultured under high glucose (HG) and then cell migration assays were performed with transwell chambers. (C) HK-2 cells treated with high glucose (HG) were transfected with circ_0009885 siRNA and then cell migration assays were performed with transwell chambers. (D) HK-2 cells treated with high glucose (HG) were transfected with circ_0011760siRNA and then cell migration assays were performed with transwell chambers. (E) HK-2 cells treated with high glucose (HG) were transfected with circ_0043757 siRNA and then cell migration assays were performed with transwell chambers.

Figure 9 The number distribution of differential genes on GO term. The number distribution of differential genes on Gene Ontology (GO) term was analyzed from biological process, cellular component and molecular function by GO enrichment analysis.
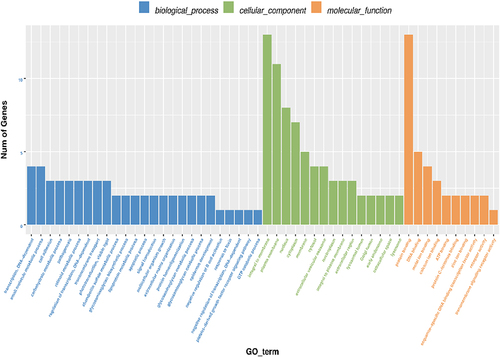
Figure 10 Identification the biological role of exosomal circRNAs by GO analysis. GO analysis of the parental genes was performed based on three terms, including biological processes, cellular components and molecular functions. The top 20 terms with p-value under 0.05 were presented.
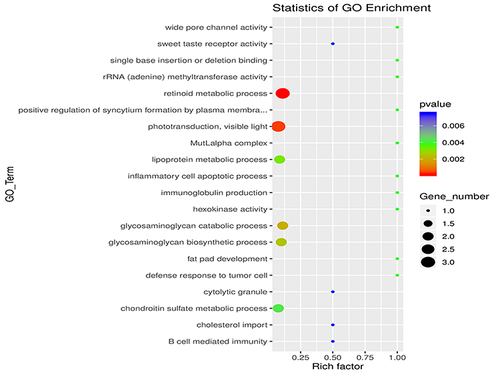
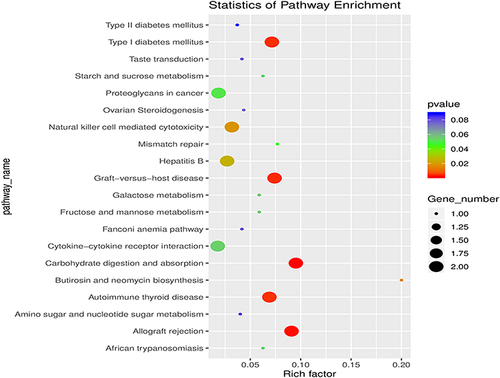
Figure 11 Identification the biological role of exosomal circRNAs by KEGG analysis. The related biological pathways were analyzed by Kyoto Encyclopedia of Genes and Genomes (KEGG). The top 20 terms were presented.