
Figures & data
Table 1 PCR Primers and Products for PLA2G7 Gene
Figure 1 PCR products were sequenced for rs1805017 loci of PLA2G7 gene polymorphism (reverse sequencing). (A) rs1805017-A/A; (B) rs1805017-A/G; (C) rs1805017-G/G.
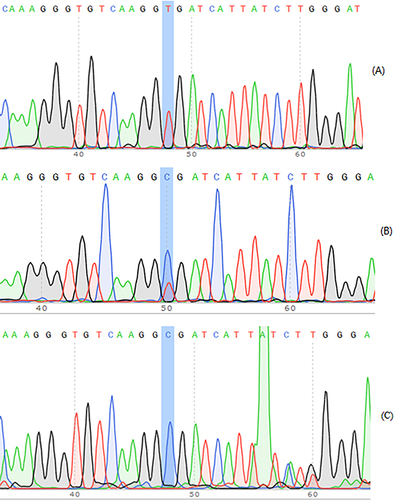
Figure 2 PCR products were sequenced for rs1805018 loci of PLA2G7 gene polymorphism. (A) rs1805018-T/T; (B) rs1805017-C/T; (C) rs1805017-C/C.
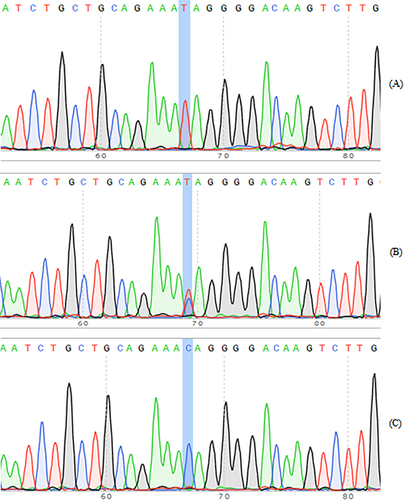
Figure 3 PCR products were sequenced for rs76863441 loci of PLA2G7 gene polymorphism (reverse sequencing). (A) rs76863441-G/G; (B) rs76863441-G/T; (C) rs76863441-T/T.
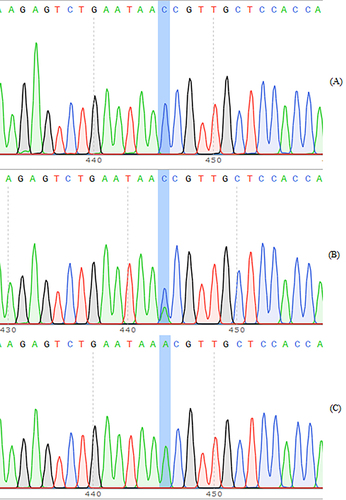
Table 2 The Participates Characteristics of Both GDM Group and Control Group (Mean ± SD)
Table 3 Comparison of PLA2G7 Genotype and Allele Frequency Between GDM Group and Control Group
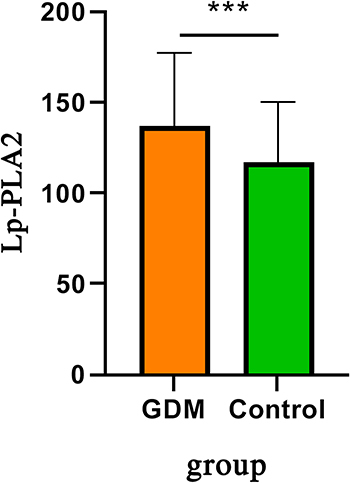
Figure 4 Lp-PLA2 concentration was significantly higher in GDM group than control group. ***P<0.05.
Data Sharing Statement
All data generated or analyzed during this study are included in this published article.