Figures & data
Table 1 The Clinical and Demographic Characteristics of the Included DFU and Non-DFU Patients
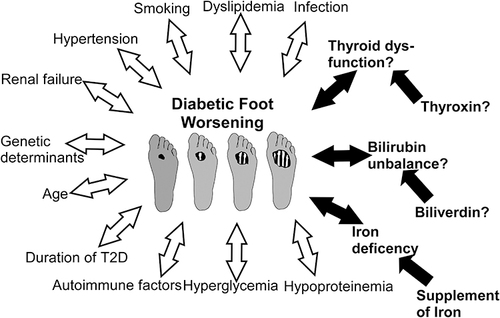
Figure 1 The age (A), duration of diabetes (B), smoking history (C), blood pressure (D), glucose metabolism (E), hemoglobin A1c (F), HOMA-IR (G), HOMA-β (H), and lipid profiles (I–N), sdLDL level (J), LP(a) level (K), APOA1 level (L), APOA2 (M), APOE (N) between the patients with and without DFU. The results showed that despite of matched parameters, there were significant disparities in age, smoking history, sdLDL level (J), LP(a) level (K), APOA1 level (L) between the DFU and non DFU.
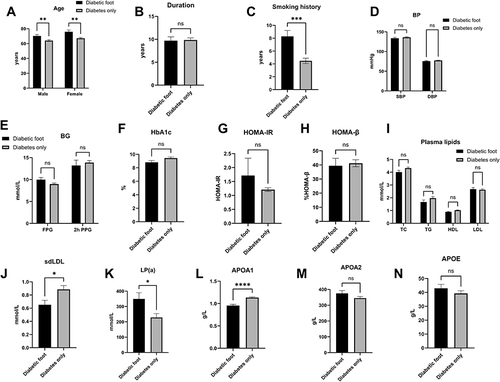
Figure 2 The disparity in protein concentration (A), bilirubin (B), transferase (C), and BUN (D), SCr (E), UA (F), eGFR (G), UACR (H) between patients with and without DFU. The comparison results revealed that significant differences exist in hepatic and kidney function in terms of albumin content, ALT, SCr, UA, eGFR between the DFU and non DFU.
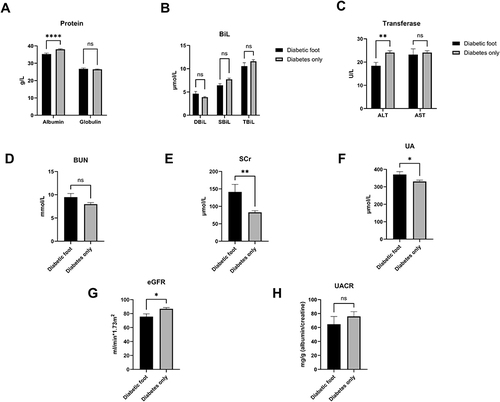
Figure 3 The distinction of thyroid hormones: FT3 (A), FT4 (B), TT3 (C), TT4 (D), TPOAb (E), procalcitonin (F), hemoglobin (G), serum iron (H) between the patients with DFU and non DFU. We found that compared with non DFU, the levels of FT3, FT4, TT3, Hb and serum iron were obviously different in DFU.
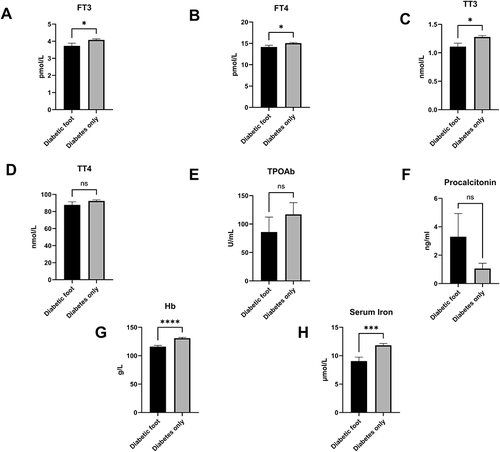
Figure 4 The heatmap shows the correlations between the severity and multiple metabolic parameters in patients with DFU. The gradient in red represents the degree of positive correlation, while the gradient in blue represents the degree of negative correlation, as shown by the color bar on the left side of the map. The correlational analyses indicated that CTA severity were positively correlated with UA, TG, while inversely with serum albumin, ALT, DBil, TBil, Hb. The level of serum iron were correlated with albumin, globin, ALT, SBil, TBil, TG, LDL, sdLDL, APOA1, FT3, FT4, TT3. We also found that FT3 is associated with age, FPG, albumin, globulin, SBil, TBil, iron, SCr, BUN, UA, eGFR, TC, HDL, LDL, sdLDL, APOA1, PCT.
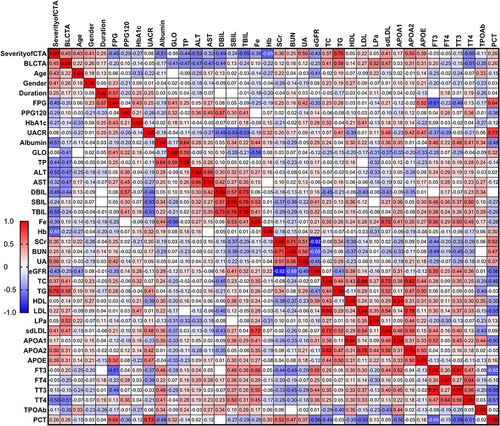
Table 2 The Multilinear Regression Analyses on FT3 and Its Independent Predictors
Figure 5 (A) The presentation of bubble figure depicts the relationship between critical factors including eGFR, APOA1, HOMA-β and the change in FT3 levels. We found that as with the increase in eGFR, the FT3 level is improved as the APOA1 elevation, accompanied by the increase in HOMA-β. (B) The presentation of bubble figure depicts the relationship between critical factors including eGFR, APOA1, SBIL and the change in FT3 levels. We found that as with the increase in eGFR, the FT3 level is improved as the APOA1 elevation, accompanied by the increase in substituted SBil.
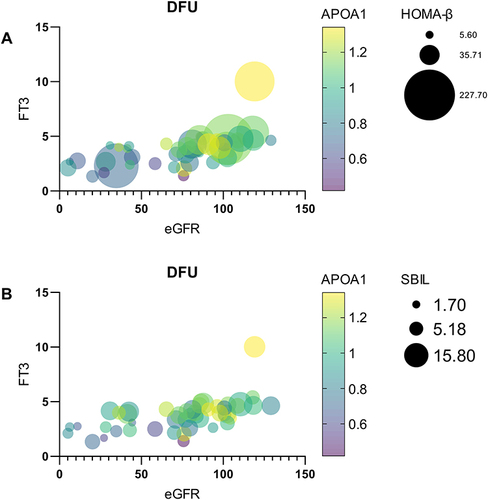
Figure 6 Multiple local and systemic factors affect the progression of DFU. The blank arrows represent permanent acknowledged causes, while the black arrows indicate systemic factors that could be rectified in whole or in part. It was uncertain whether abnormal thyroid function and bilirubin imbalance should be treated.