Figures & data
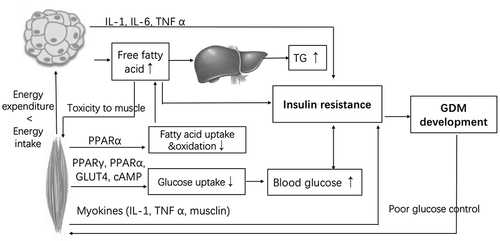
Figure 1 Flowchart showing recruitment in the study according to STROBE guideline.Citation17
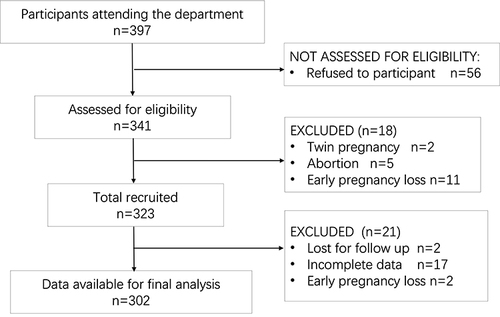
Table 1 Characteristics of GDM and Non-GDM Group
Table 2 Pearson’s Correlation Analysis Associated with GDM Diagnosis
Table 3 Poisson Regression Analysis
Table 4 AUC for Variables Computed with ROC Analysis for GDM
Figure 2 ROC curves for the accuracy of the GDM prediction model.
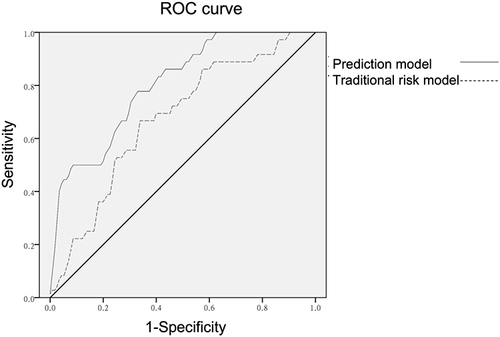
Figure 3 Relationships between adipose tissue, skeletal muscle, blood glucose and TG. This figure summarizes the relevance of inadequate muscle to increased blood glucose and FFA, and insulin resistance via inflammation and cytokines; and the relevance of excessive of adipose tissue to the increased TG and insulin resistance via inflammatory pathways. High level of FFA can cause hypertriglyceride, insulin resistance, and toxicity to muscle directly. Poor glucose control will lead to muscle loss.