
Figures & data
Figure 1 Guinea pig aortic arch was examined using H&E-stained microscope slides in each group. (A) Blank group (400x magnification). (B) Model group (400x magnification). (C) Intervention group (400x magnification). (D) Blank group (20x magnification). (E) Model group (20x magnification). (F) Intervention group (20x magnification).
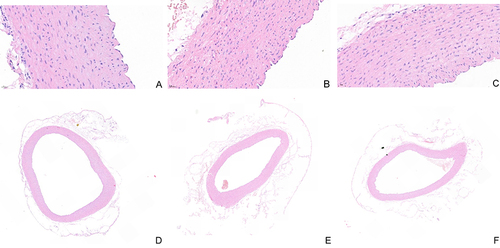
Figure 2 (A) Number of common and specific OTUs in the intestinal microbiota of Guinea pigs in each group (unit: pcs). (B) Histogram of species relative abundance of the intestinal microbiota of Guinea pigs in each group (phylum level).
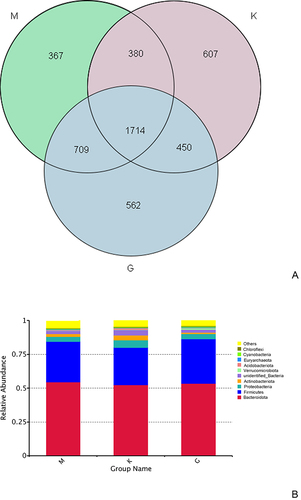
Figure 3 (A) Species diversity dilution curve. (B) Species diversity hierarchy clustering curve.
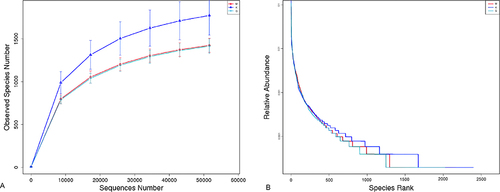
Figure 4 (A) Box plot of between-group differences of observed_species indicator. (B) Box plot of between-group differences of Shannon indicator.
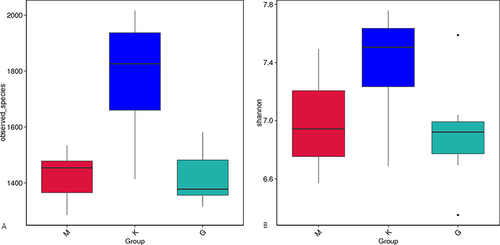
Table 1 Between-Group Difference Analysis Using ANOSIM and MRPP
Figure 5 Heatmap figure of species significance differences between groups.
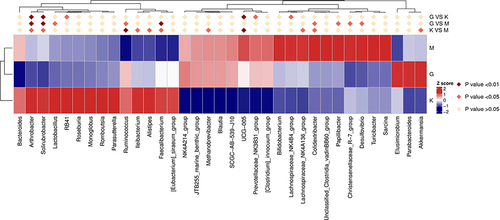
Table 2 Comparison of Four Components of the Blood Lipids Test in the Guinea Pigs of Each Group (, mmol/L)
Table 3 Comparison of Serum TMAO Concentrations in Guinea Pigs in Each Group (, ng/mL)
Table 4 Comparison of the Oxidative Stress Indicators SOD and MDA in the Guinea Pigs in Each Group ()
Table 5 Comparison of Serum Inflammatory Markers in Guinea Pigs in Each Group