
Figures & data
Table 1 Comparison of Clinical Characteristics Between T2DM Patients with and without DCAN
Table 2 Characteristics of Patients According to FAR and FPR Quartiles
Table 3 Odds Ratio for Diabetic Cardiac Autonomic Neuropathy
Table 4 Odds Ratio for DCAN According to FAR and FRP Quartiles
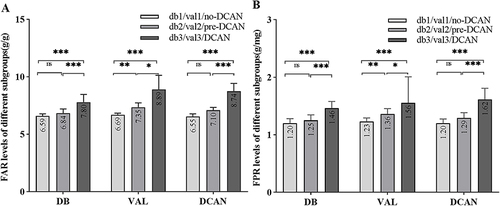
Figure 1 Evaluate the levels of FAR and FPR in different subgroups (median with 95% CI).
Notes: ns P > 0.05; * P < 0.05; ** P < 0.01; *** P < 0.001. FAR levels in different subgroups (A). FPR levels in different subgroups (B). DB: the difference between the maximum and minimum heart rates during deep breathing. DB ≥ 15 as normal (db1), between 10–15 as critical (db2), DB ≤ 10 as abnormal (db3). VAL: the ratio of the longest to shortest R-R interval during the Valsalva maneuver. VAL ≥ 1.21 as normal (val1), between 1.10–1.21 as crucial (val2), VAL ≤ 1.10 as abnormal (val3). DCAN: diagnosed DCAN. No-DCAN: diabetic patients without DCAN. Pre-DCAN: diabetic patients with subclinical DCAN. Non-DCAN includes No-DCAN and Pre-DCAN.
Abbreviations: FAR, fibrinogen-to-albumin ratio; FPR, fibrinogen-to-prealbumin ratio.
Data Sharing Statement
The datasets used and/or analyzed during the current study are available from the corresponding author on reasonable request.