Figures & data
Figure 1 Study flow chart.
Abbreviations: NMG, normal metabolism glucose; pre-DM, prediabetes; DM, diabetes mellitus; ACS, acute coronary syndrome; PCI, percutaneous coronary intervention; CABG, Coronary Angioplasty Bypass Grafting; OMI, old myocardial infarction.
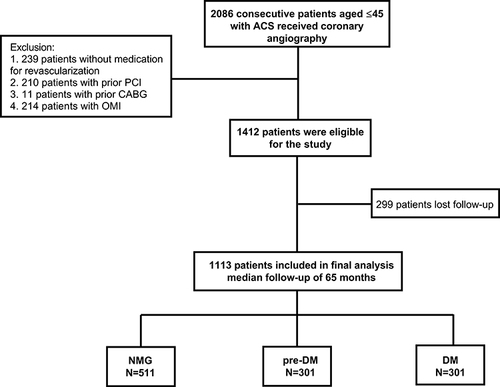
Table 1 Baseline Characteristics of Patients According to Glucose or HbA1c on Admission
Table 2 Clinical Presentation and Coronary Angiography Outcomes of Patients According to Glucose or HbA1c on Admission
Table 3 Clinical Outcomes of Young Patients with ACS During the Follow-Up
Table 4 Univariate and Multivariate Cox Regression Analysis of Events According to Glucose or HbA1c on Admission
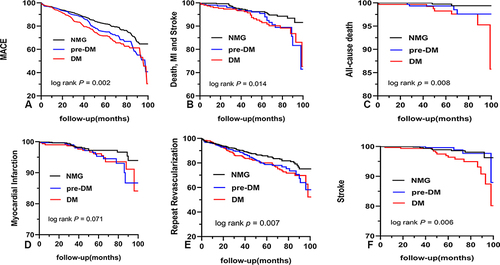
Figure 2 Kaplan-Meier survival curve for MACE (A), Death, MI and Stroke (B), All-cause death (C), Myocardial infraction (D), Repeat revascularization (E) and Stroke (F).
Abbreviations: NMG, normal metabolism glucose; pre-DM, prediabetes; DM, diabetes mellitus. MACE, major adverse cardiovascular events; Death, MI and stroke, the composite of all-cause death, myocardial infraction and stroke.