Figures & data
Table 1 Basic Characteristics of Enrolling Patients
Table 2 Univariate Analysis of Factors Affecting in-Hospital Mortality in Elderly Patients with AMI
Table 3 Multivariate Logistic Regression Analysis of ApoB/apoA-1 and in-Hospital Mortality in Elderly Patients with AMI
Figure 1 The ROC analysis of apoB/apoA-1 predicting in-hospital death in elderly AMI patients. (A) The ROC analysis of apoB/apoA-1 predicting in-hospital death in elderly AMI patients; (B) Comparison of the predictive ability of apoB/apoA-1 on the risk of in-hospital mortality between elderly STEMI patients and NSTEMI patients.
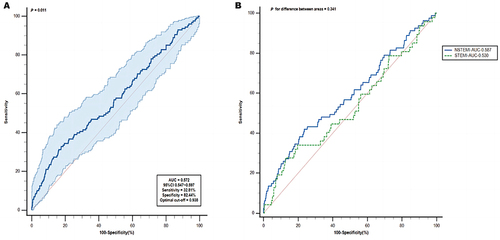
Figure 2 Dose-response relationship between apolipoprotein-related markers and in-hospital mortality in elderly patients with AMI. (A) Unadjusted dose-response relationship between apoB and in-hospital mortality in elderly patients with AMI; (B) Adjusted dose-response relationship between apoB and in-hospital mortality in elderly patients with AMI; (C) Unadjusted dose-response relationship between apoA-1 and in-hospital mortality in elderly patients with AMI; (D) Adjusted dose-response relationship between apoA-1 and in-hospital mortality in elderly patients with AMI; (E) Unadjusted dose-response relationship between apoB/apoA-1 and in-hospital mortality in elderly patients with AMI; (F) Adjusted dose-response relationship between apoB/apoA-1 and in-hospital mortality in elderly patients with AMI. Adjusted factors include sex, age, BMI, type of AMI, eGFR, cardiac troponin I(CTNI), presence of heart failure, diabetes, PCI during hospitalization, history of stroke, and in-hospital medication (Aspirin use and Statins use).
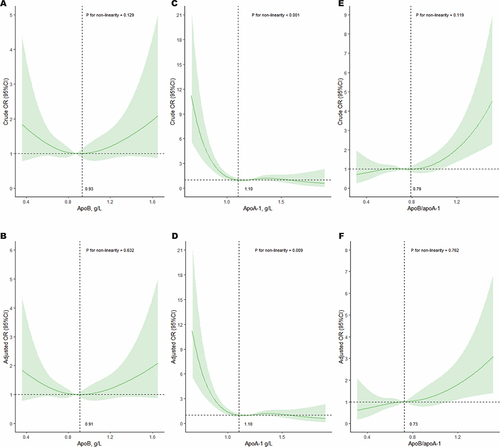
Table 4 Multivariate Logistic Regression Analysis Between Discordance Between ApoB/apoA-1 and LDL-C/HDL-C and Risk of in-Hospital Mortality in Elderly AMI Patients
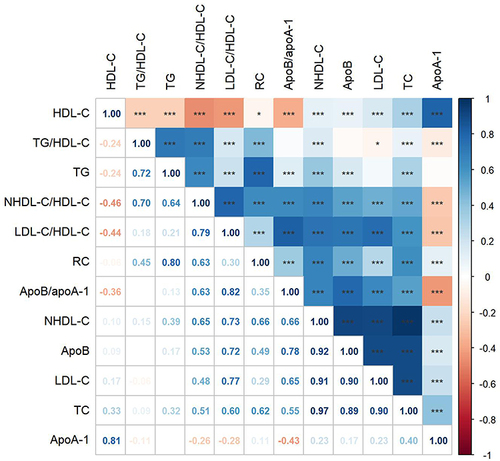
Figure 3 Spearman correlation analysis between each pair of lipid measures.