
Figures & data
Table 1 Sociodemographic and Clinical Characteristics of Participants (n = 100)
Table 2 Physical Activity Level and Sedentary Behavior During the COVID-19 Related Wellness Service Closure (n = 100)
Table 3 Sleep Status During the COVID-19 Related Wellness Services Closure (n = 100)
Figure 1 Stress level based on the perceived stress scale during COVID-related wellness service closure (n = 100).
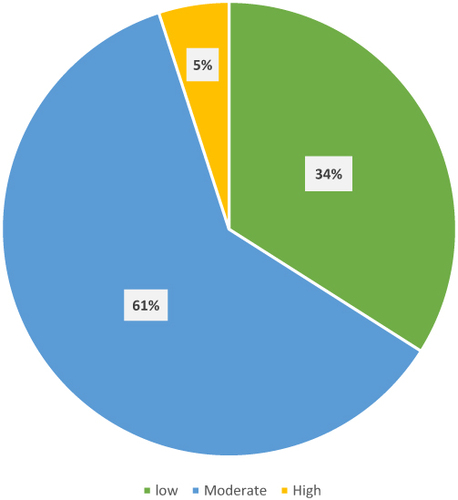
Table 4 Body Measurements and Composition According to Sex (n = 100)
Figure 2 BMI categories based on the WHO guidelines (n = 100).
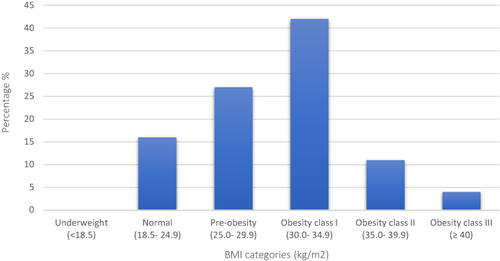
Table 5 Cardiometabolic Risk According to Waist Circumference and Wasit hip Ratio by Sex (n = 100)
Table 6 Cardiopulmonary and Muscular Endurance According to Sex (n = 100)
Table 7 Cardiopulmonary and Muscular Endurance According to Age Groups (n = 100)
Table 8 Sociodemographic and Clinical Characteristics According to the Physical Activity Level (n = 100)
Table 9 Anthropometric and Body Composition According to the Physical Activity Level (n = 100)